There are many ways LookAnalyze can help marketers in their daily work. In this article, I will walk you through 8 useful features and demonstrate how easy it is to get answers from your web statistics compared to Google Analytics or other GA alternatives.
1. Compare Your Data Between Different Periods
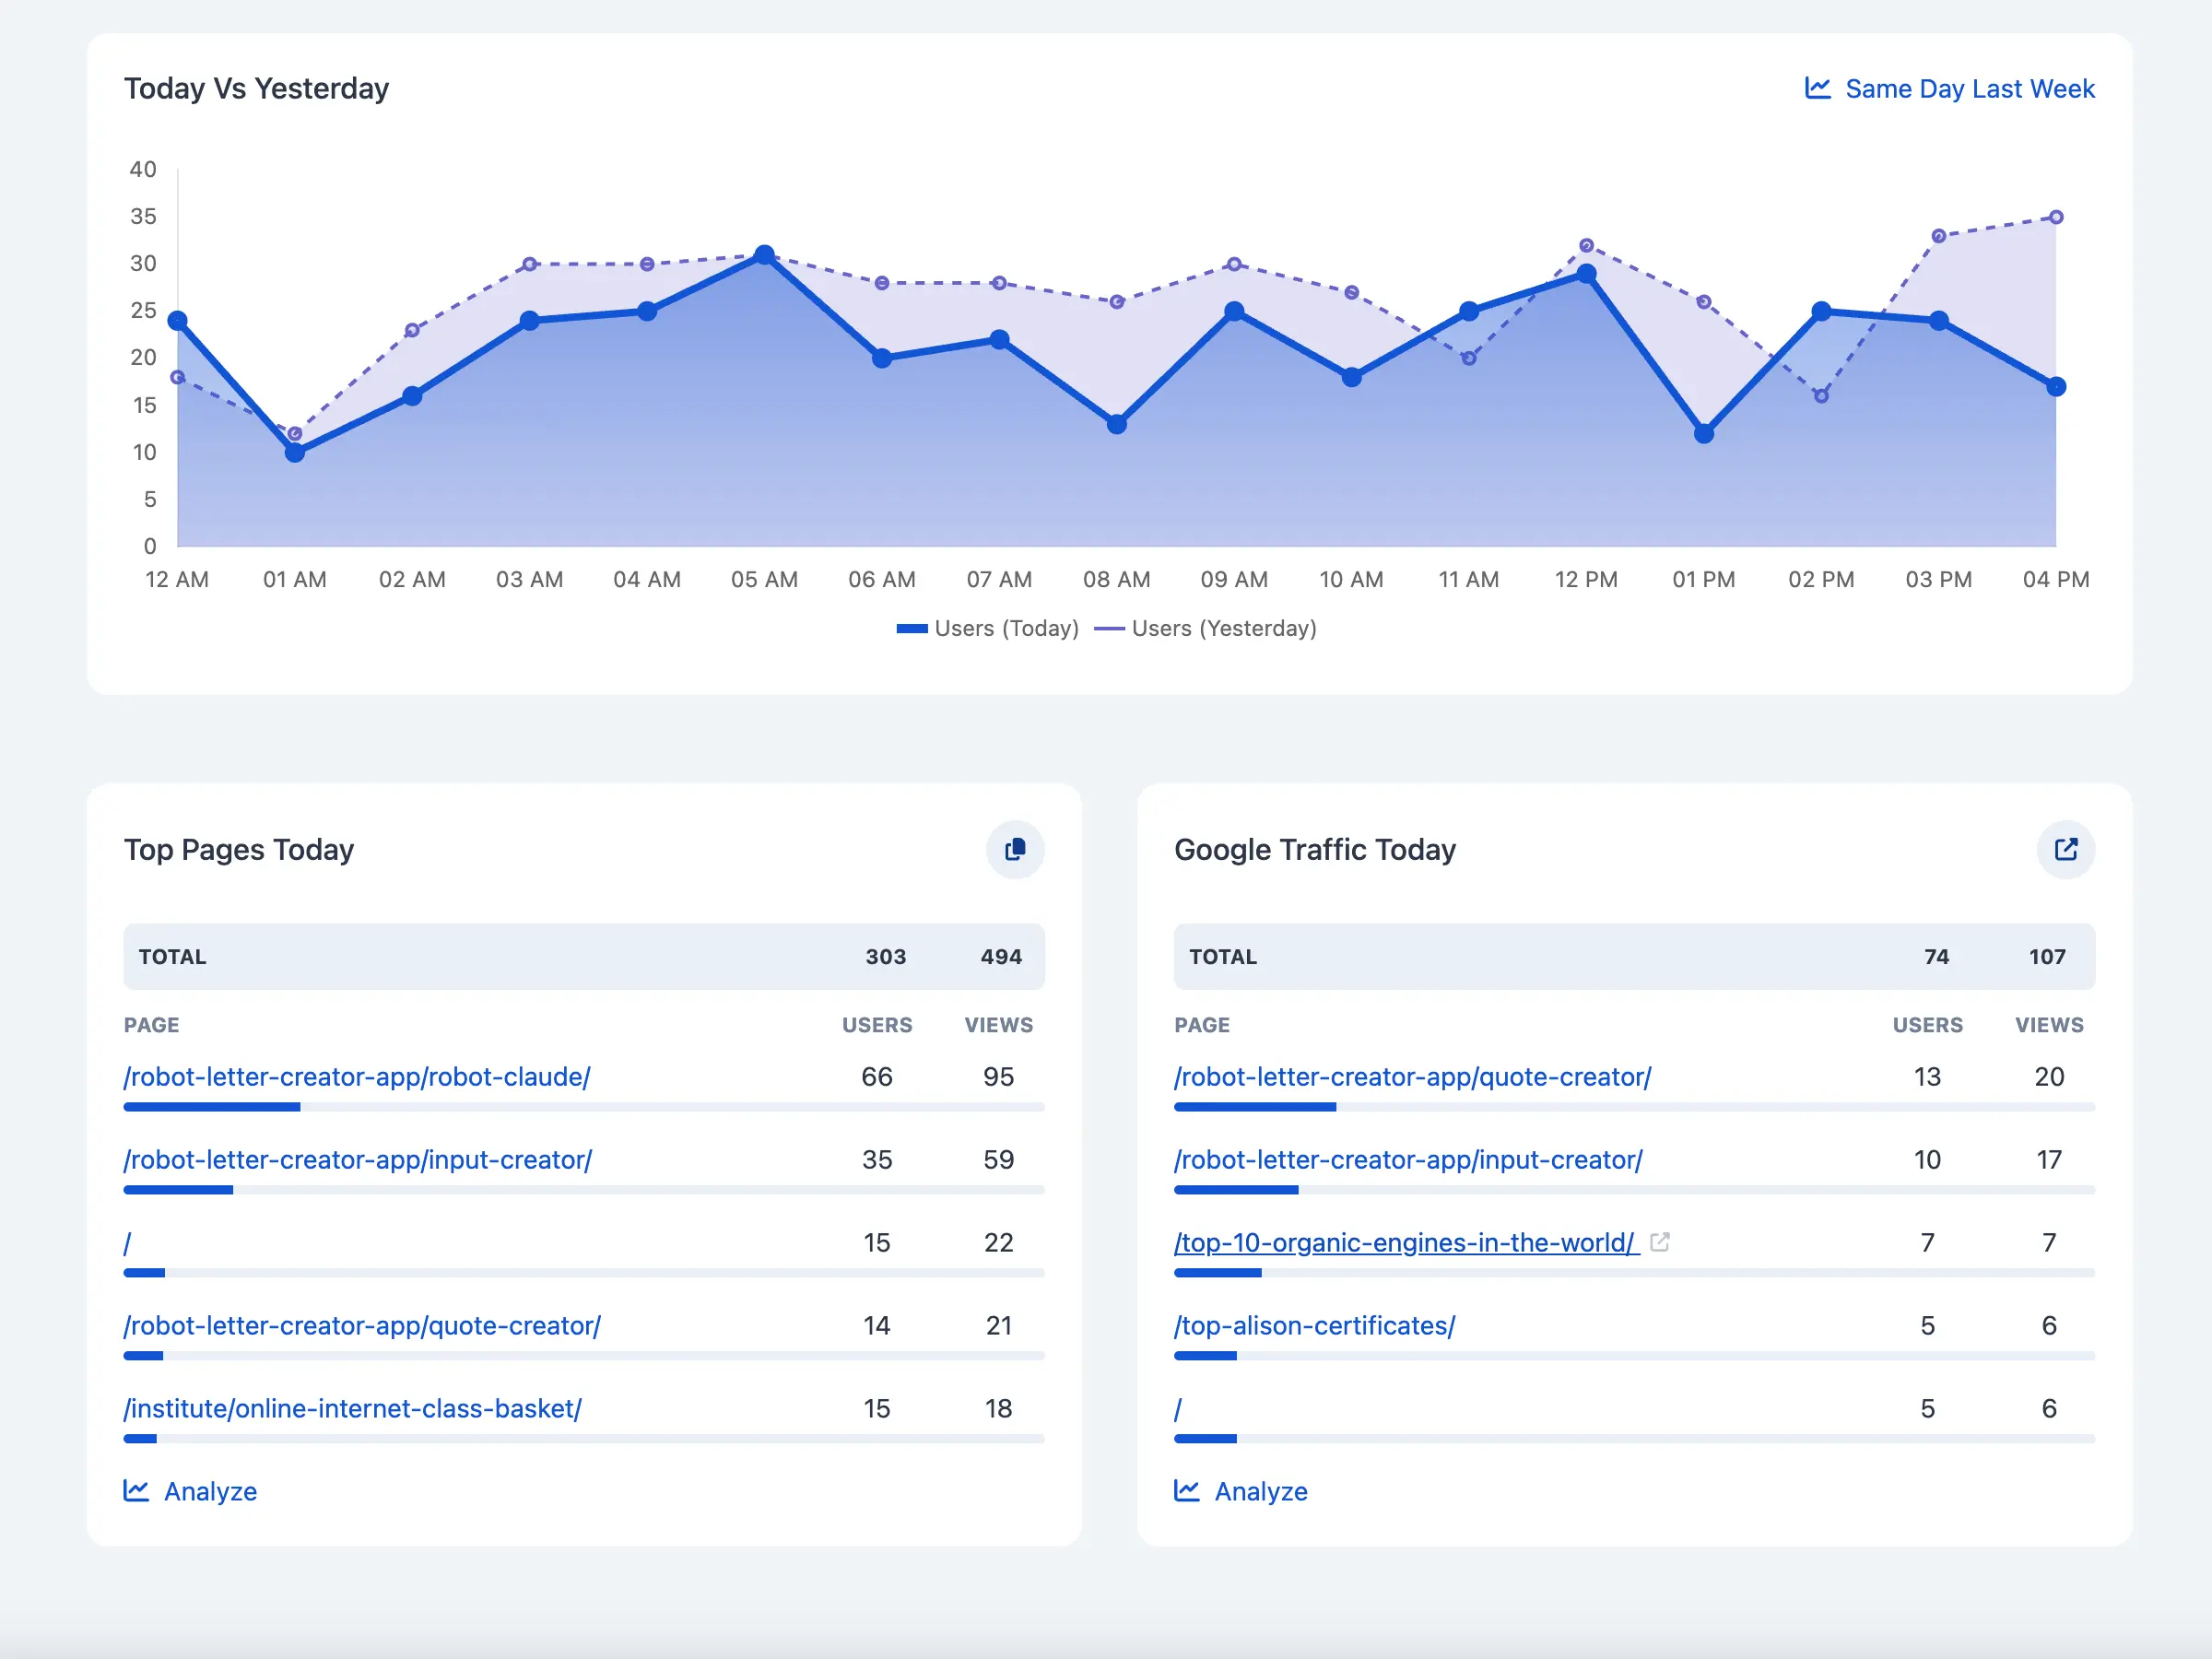
One of the unique features of LookAnalyze that differentiates it from other similar tools is the way you can compare your data between different periods.
Instead of using a single dashboard like most tools, LookAnalyze has a dedicated “Analyze” function that allows you to slice and dice your data by traffic source (e.g., Google, Facebook, etc.), traffic type (e.g., Organic Search, Social, etc.), date, or page.
Here’s how to do it:
Click on the ‘Comparison’ dropdown and select one of the predefined periods (i.e., Today to Yesterday or Yesterday to Same Day Last Week). The system will automatically set the filters on both date pickers, so you don’t have to set it manually.
Alternatively, you can use them to set your custom periods.
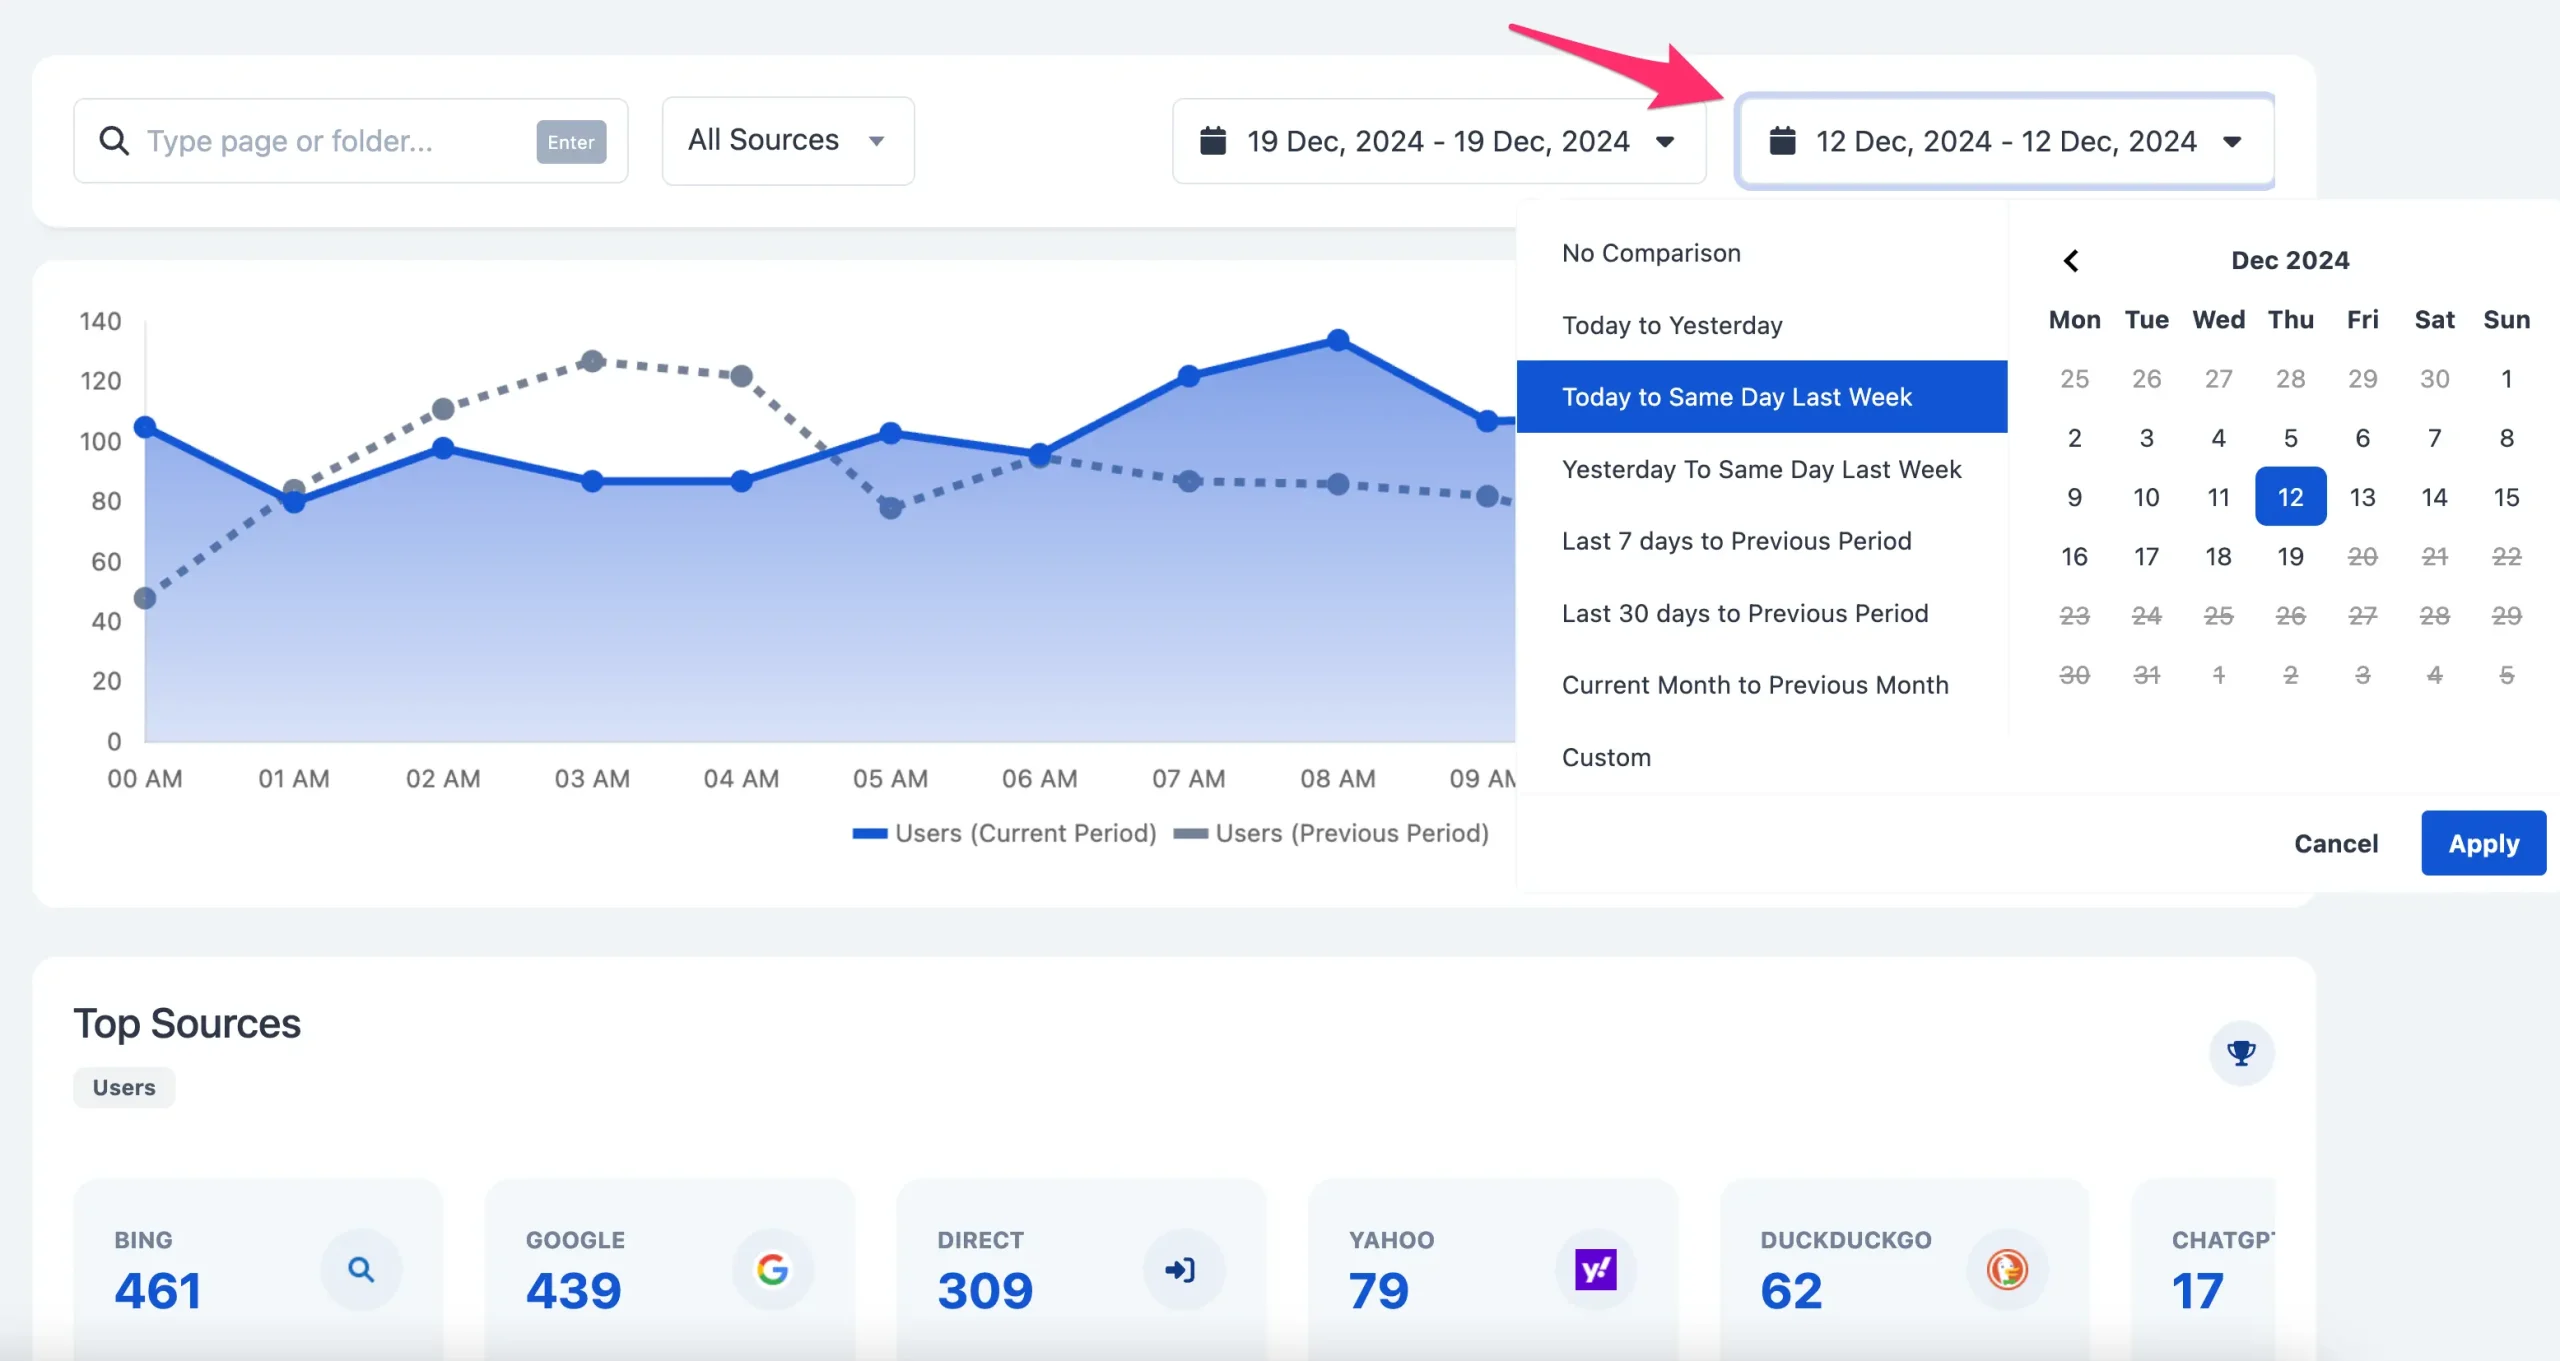
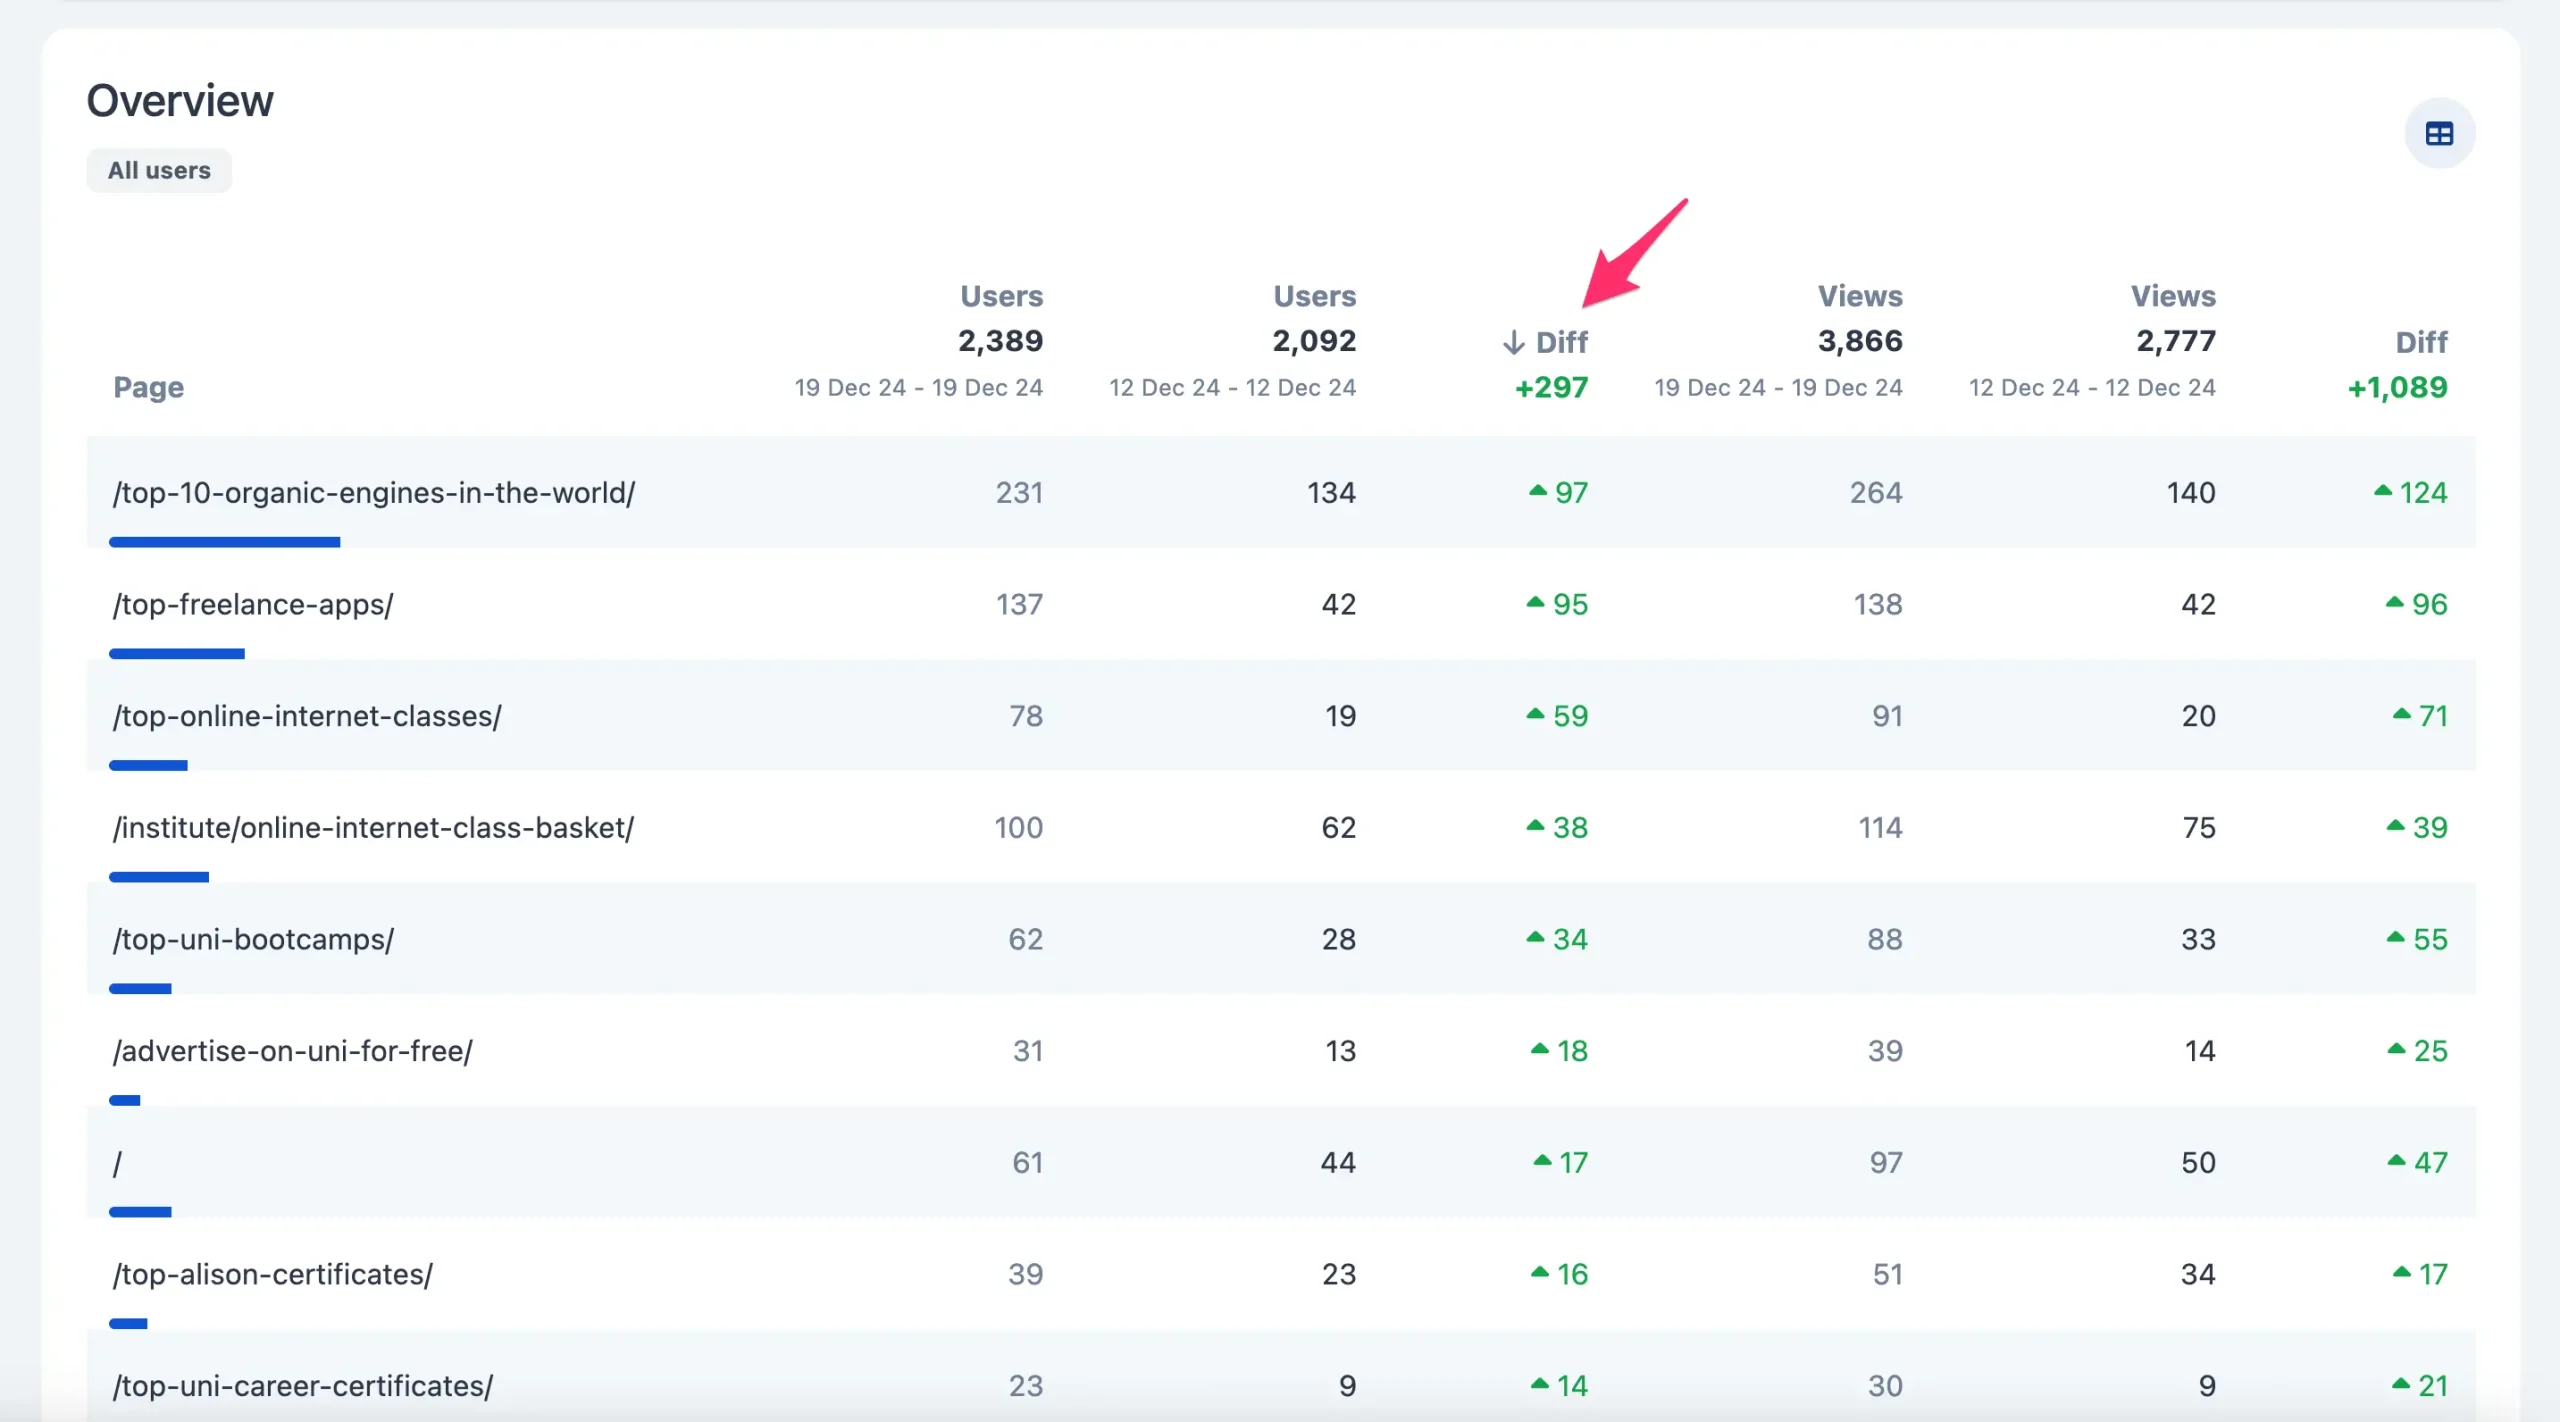
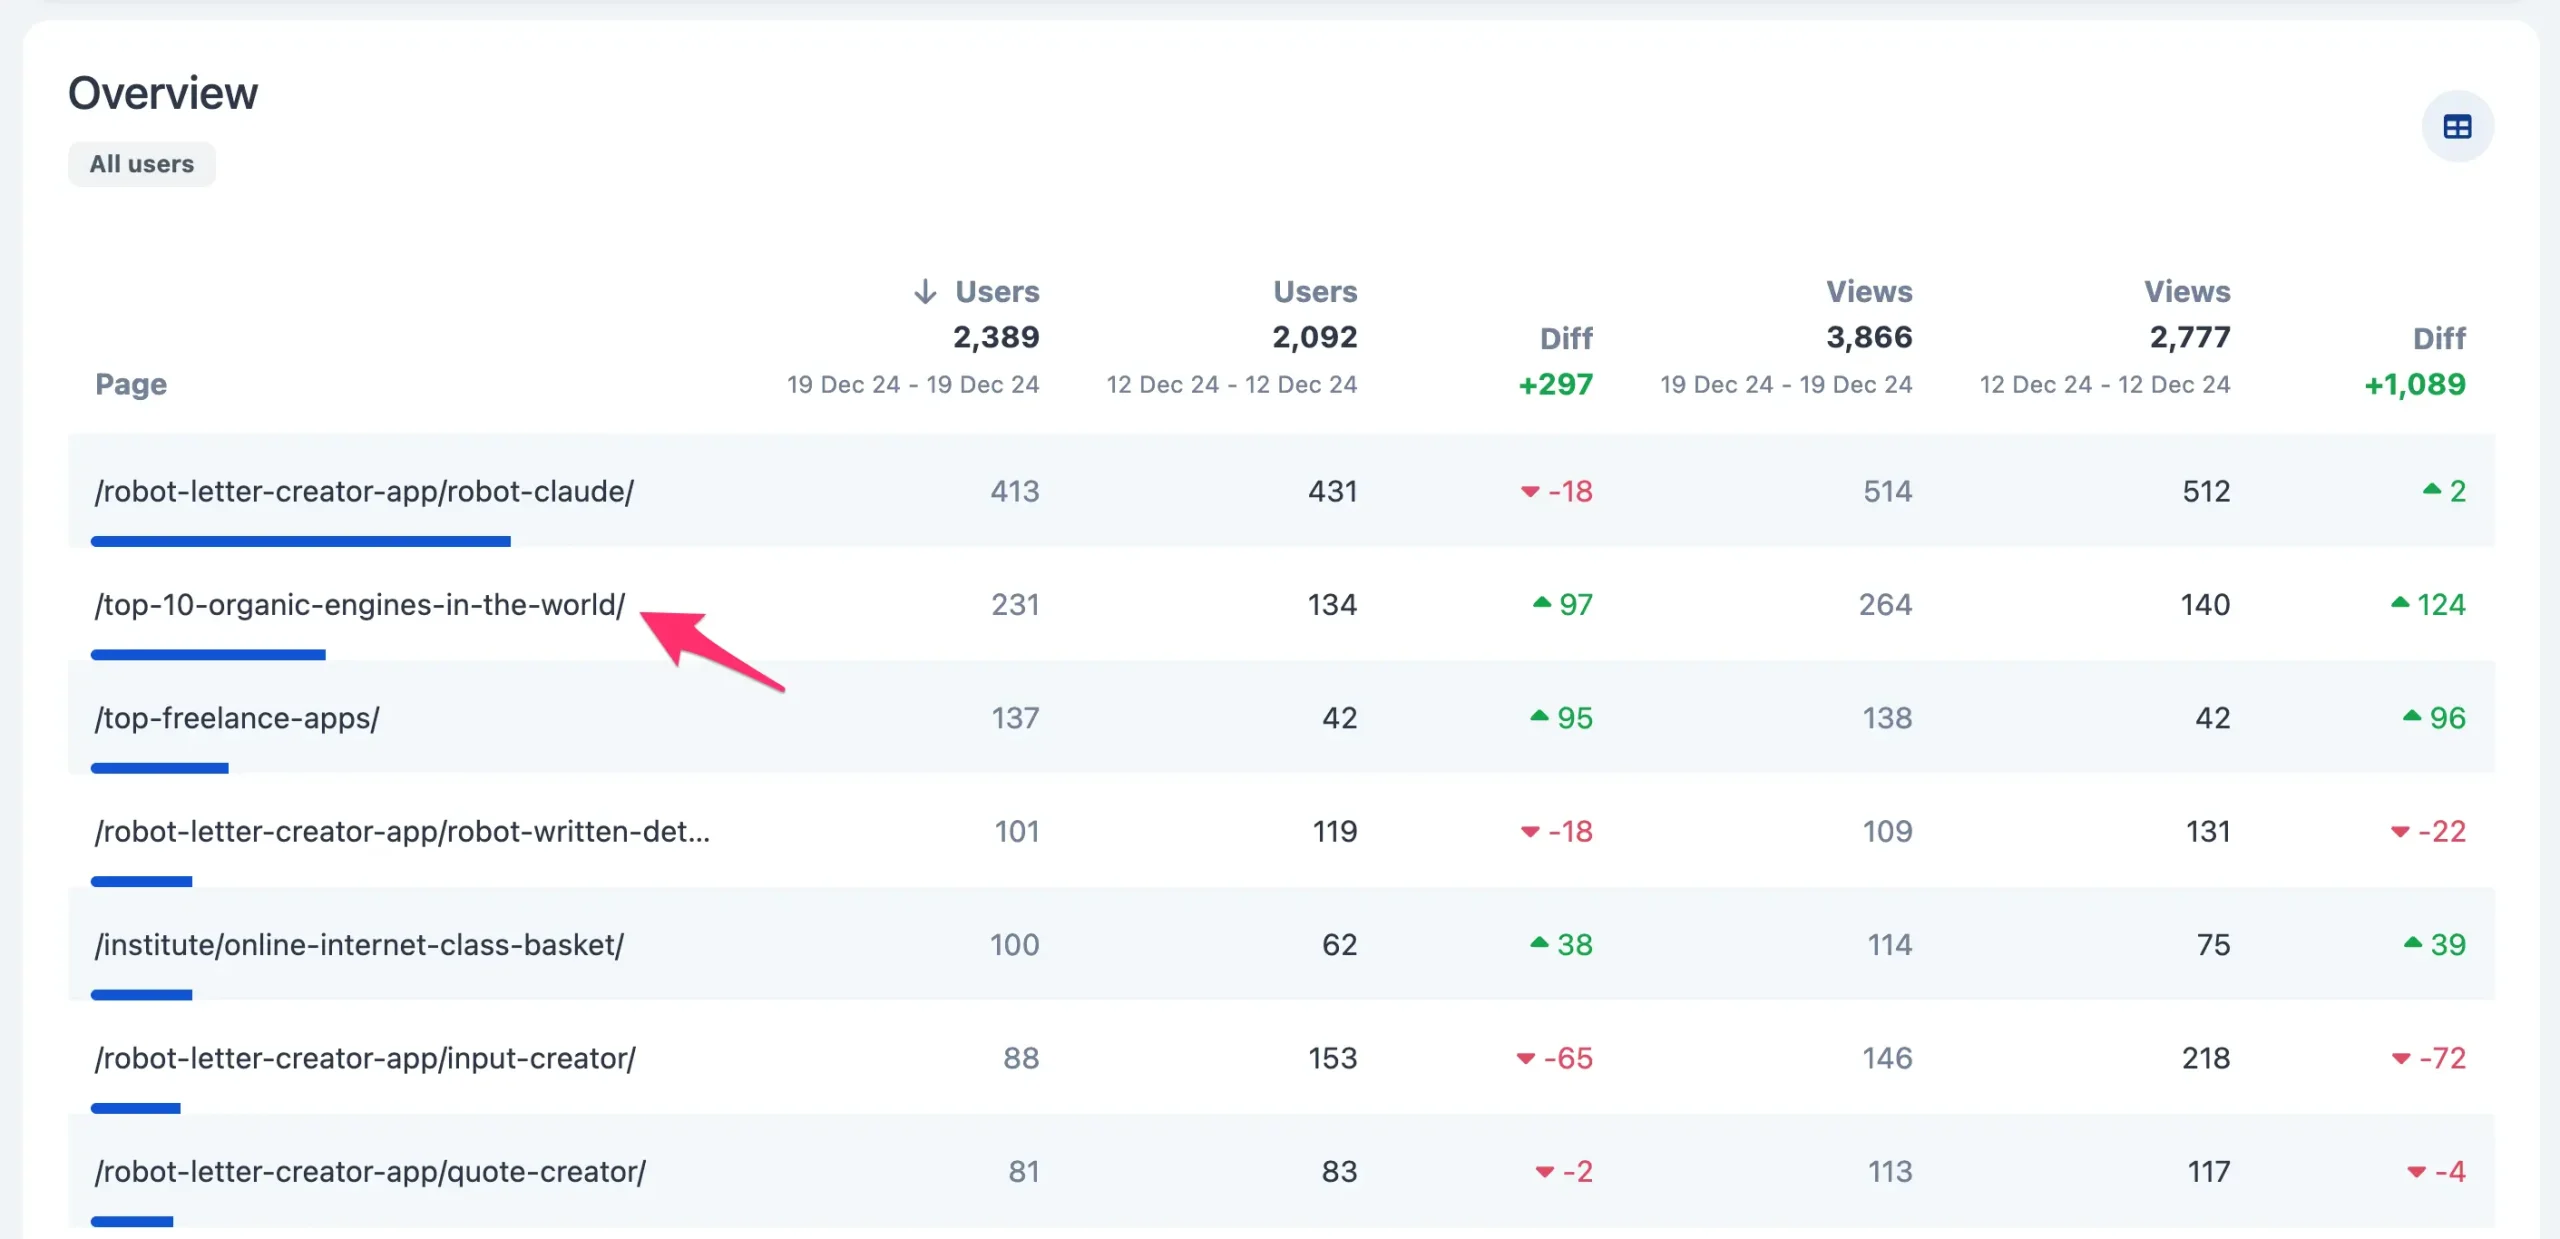
To find your ‘winners and losers’, click the ‘Diff’ column to sort the data. You can do this by users or page views.
This is useful when you notice changes in your overall traffic but don’t know which page(s) were affected the most.
2. Filter Your Traffic By Source
As a marketer, knowing which channels bring traffic to your website is important.
When you click the ‘All Sources’ dropdown, you can see your top-performing channels.
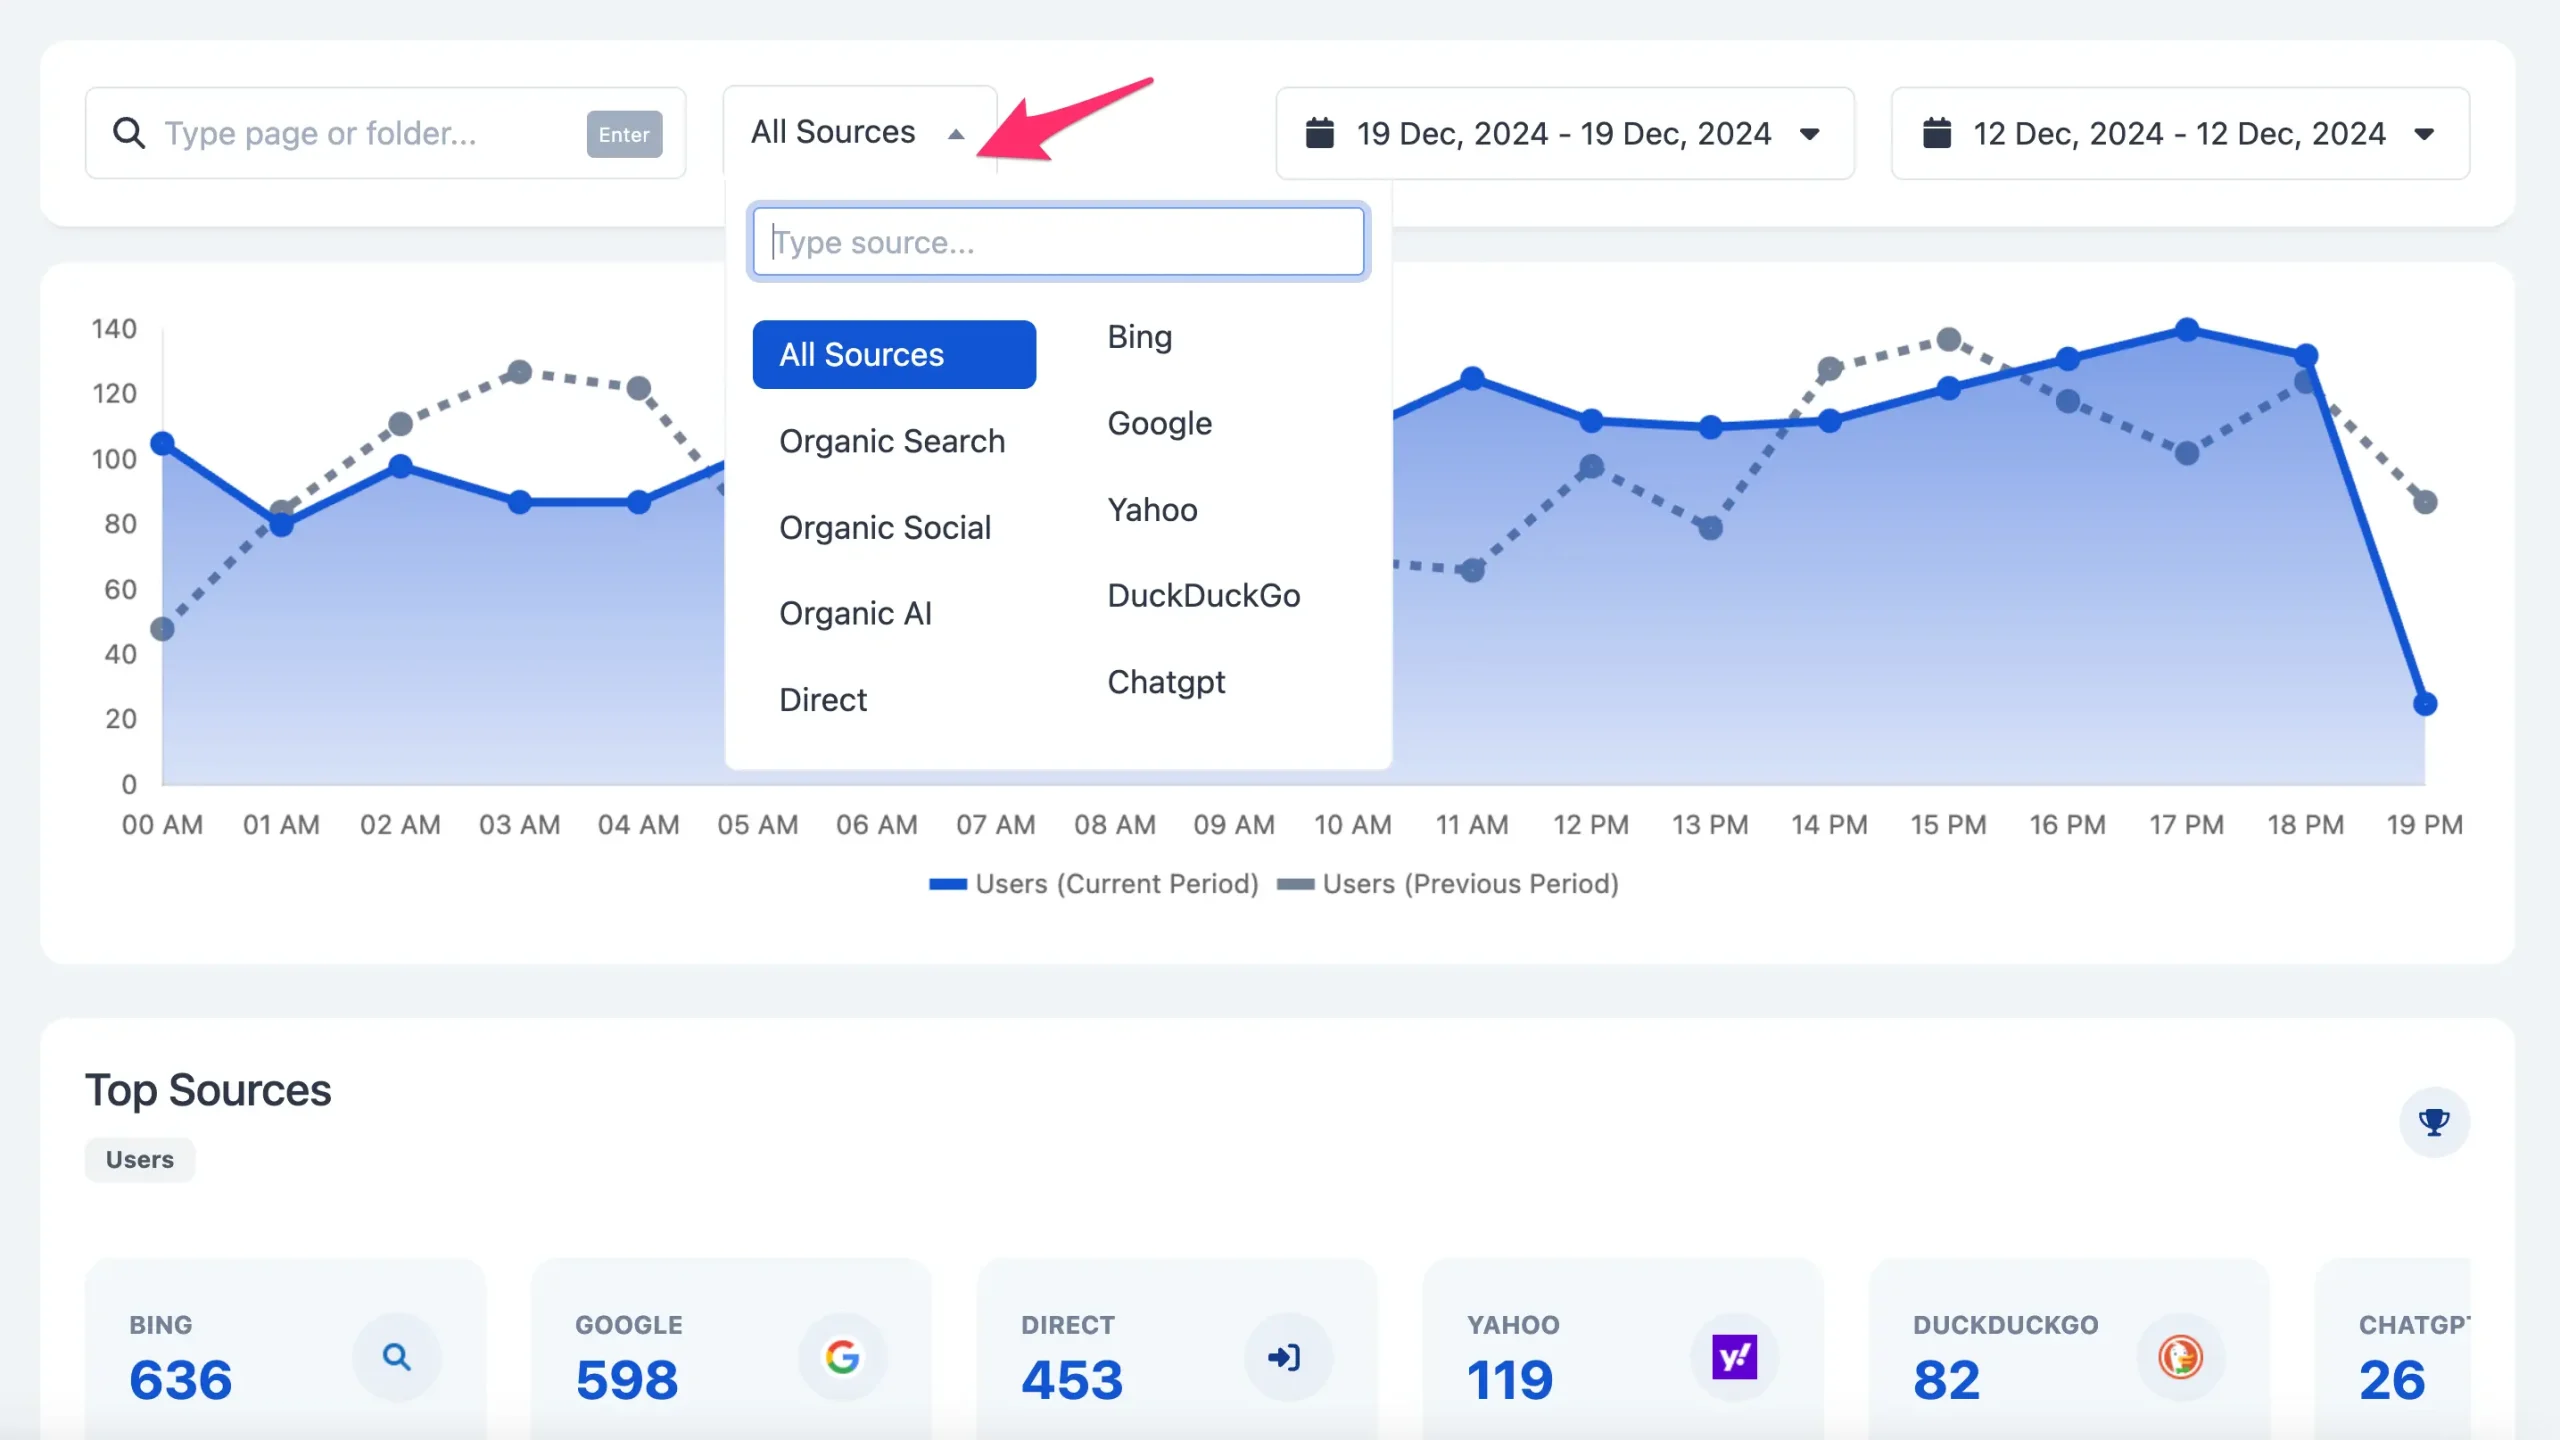
You can also use the predefined filters:
- Organic Search – includes traffic from known search engines like Google, Bing, Yahoo, and DuckDuckGo.
- Organic Social – includes traffic from social networks like Facebook, Pinterest, Instagram, TikTok and others.
- Organic AI – includes traffic from ChatGPT, Perplexity, and other known AI platforms.
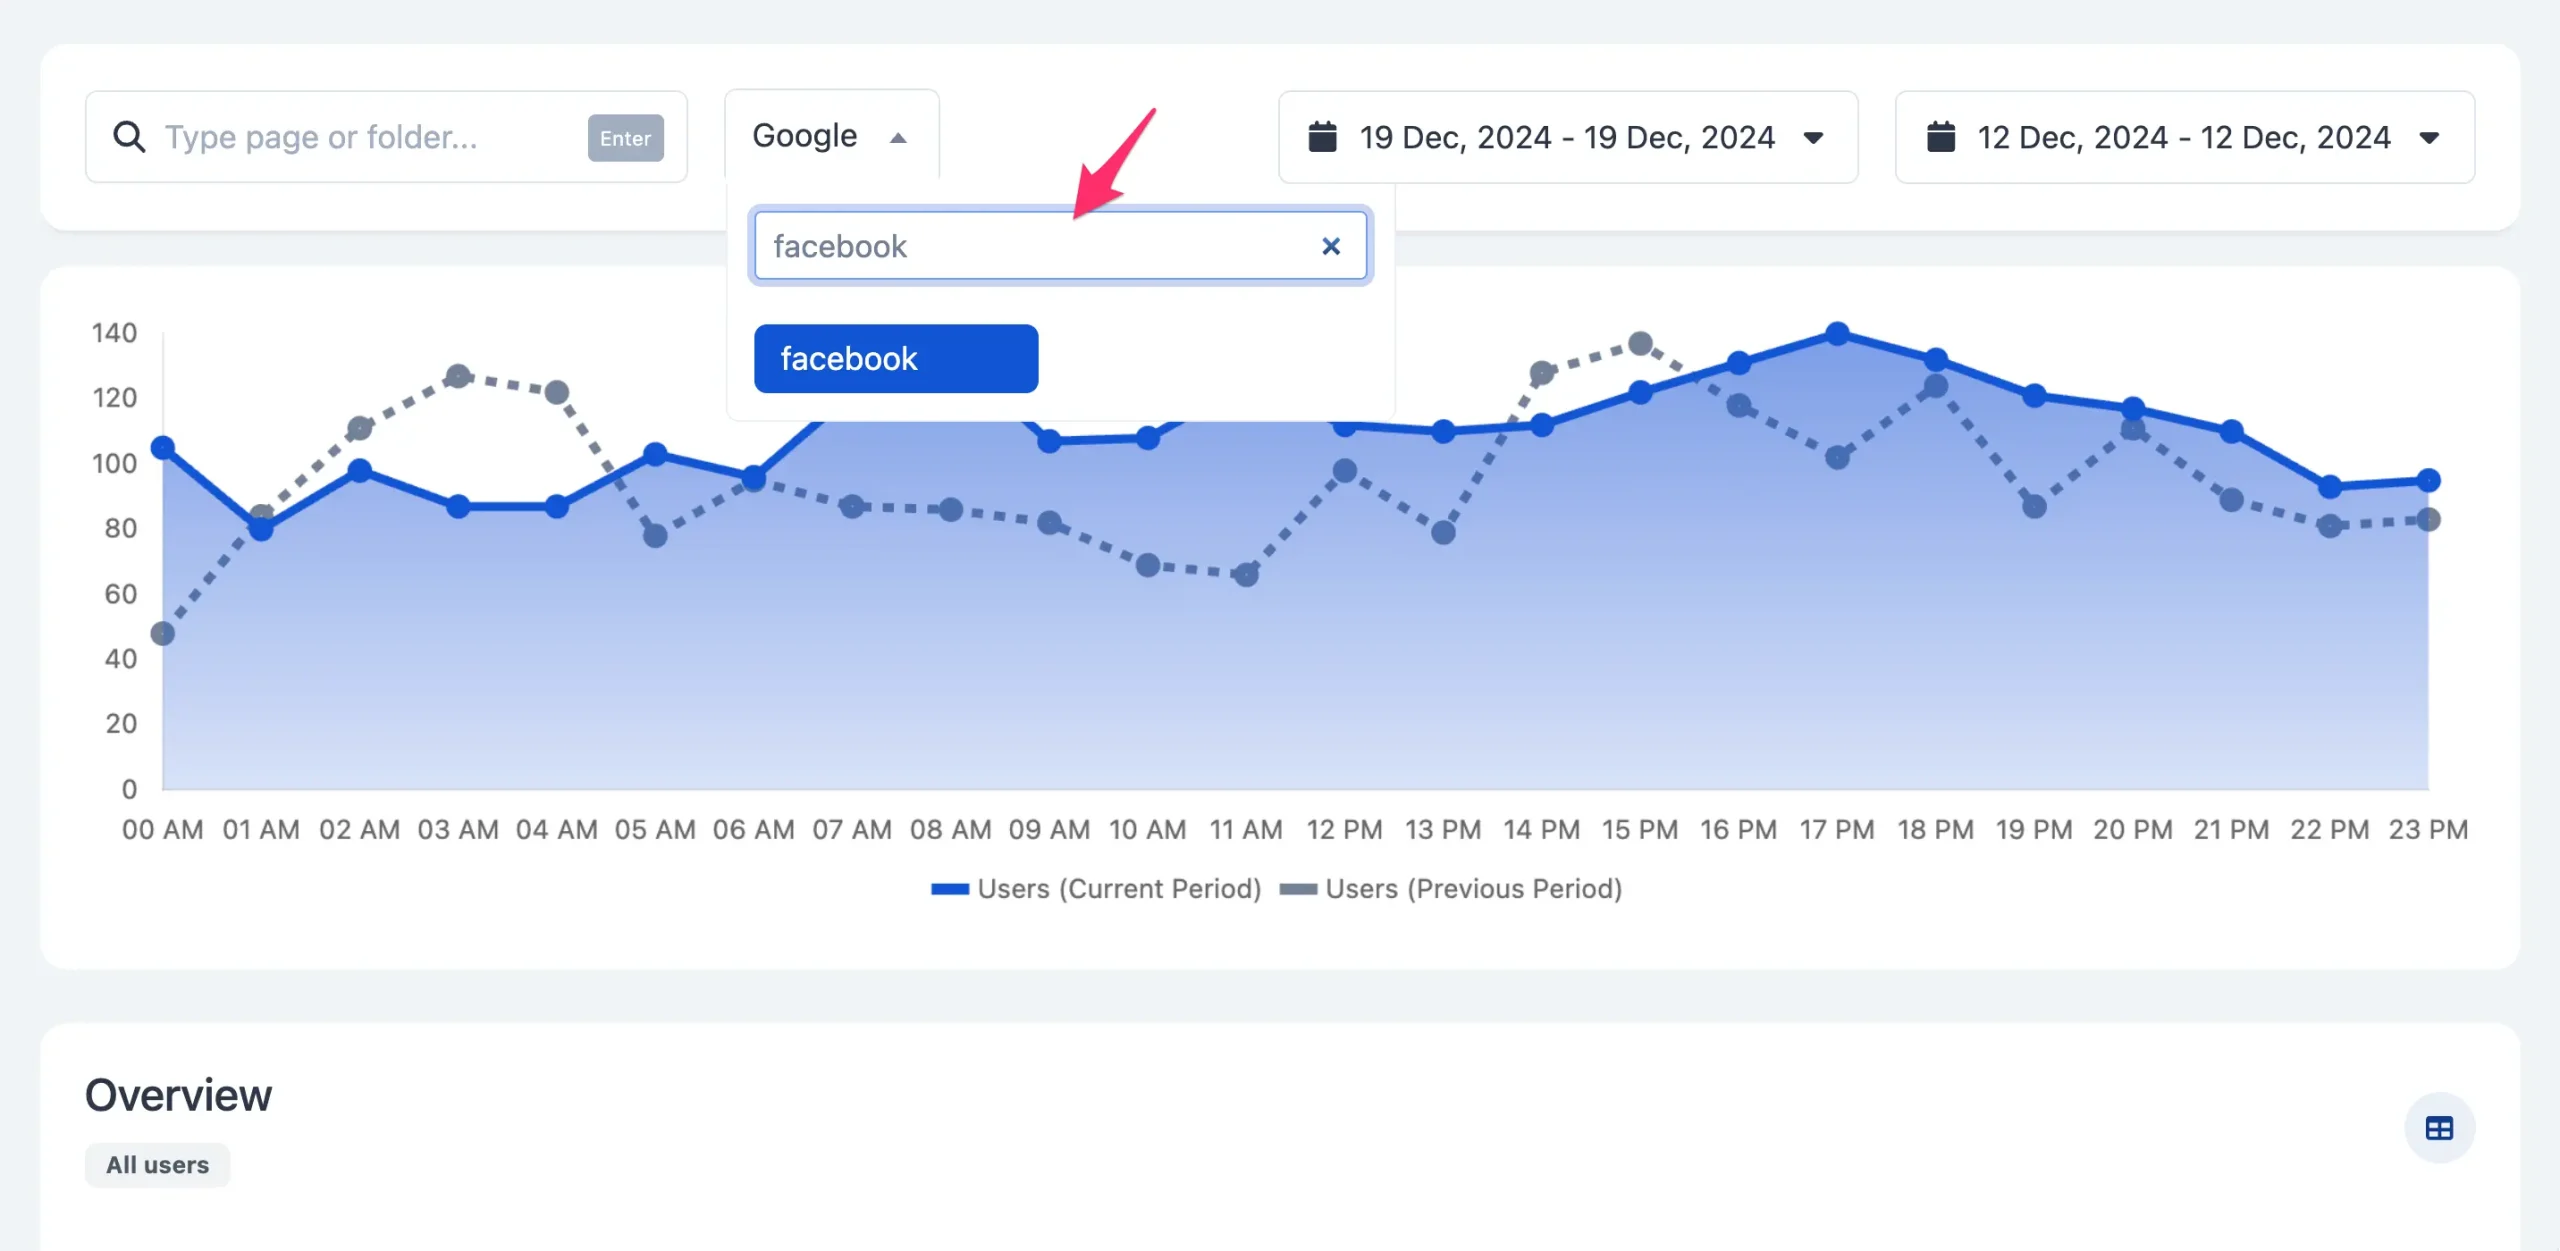
Or use the search box to type any channel, e.g., Facebook or domain.
3. Analyze Traffic By Page, Folder, or Group of Pages
Sometimes, you need to view the traffic of a specific page and see how it performs over a time period or by channel.
You can easily do this by clicking on the page URL from any dashboard and getting details on a page-level basis.
You can also use the ‘Page Filter’ to search for pages in a specific folder, i.e., “/products” or even pages that contain a particular word in the URL.
For example, if you want to view all pages with the word ‘Top’, type ‘Top’ in the filter and press Enter.
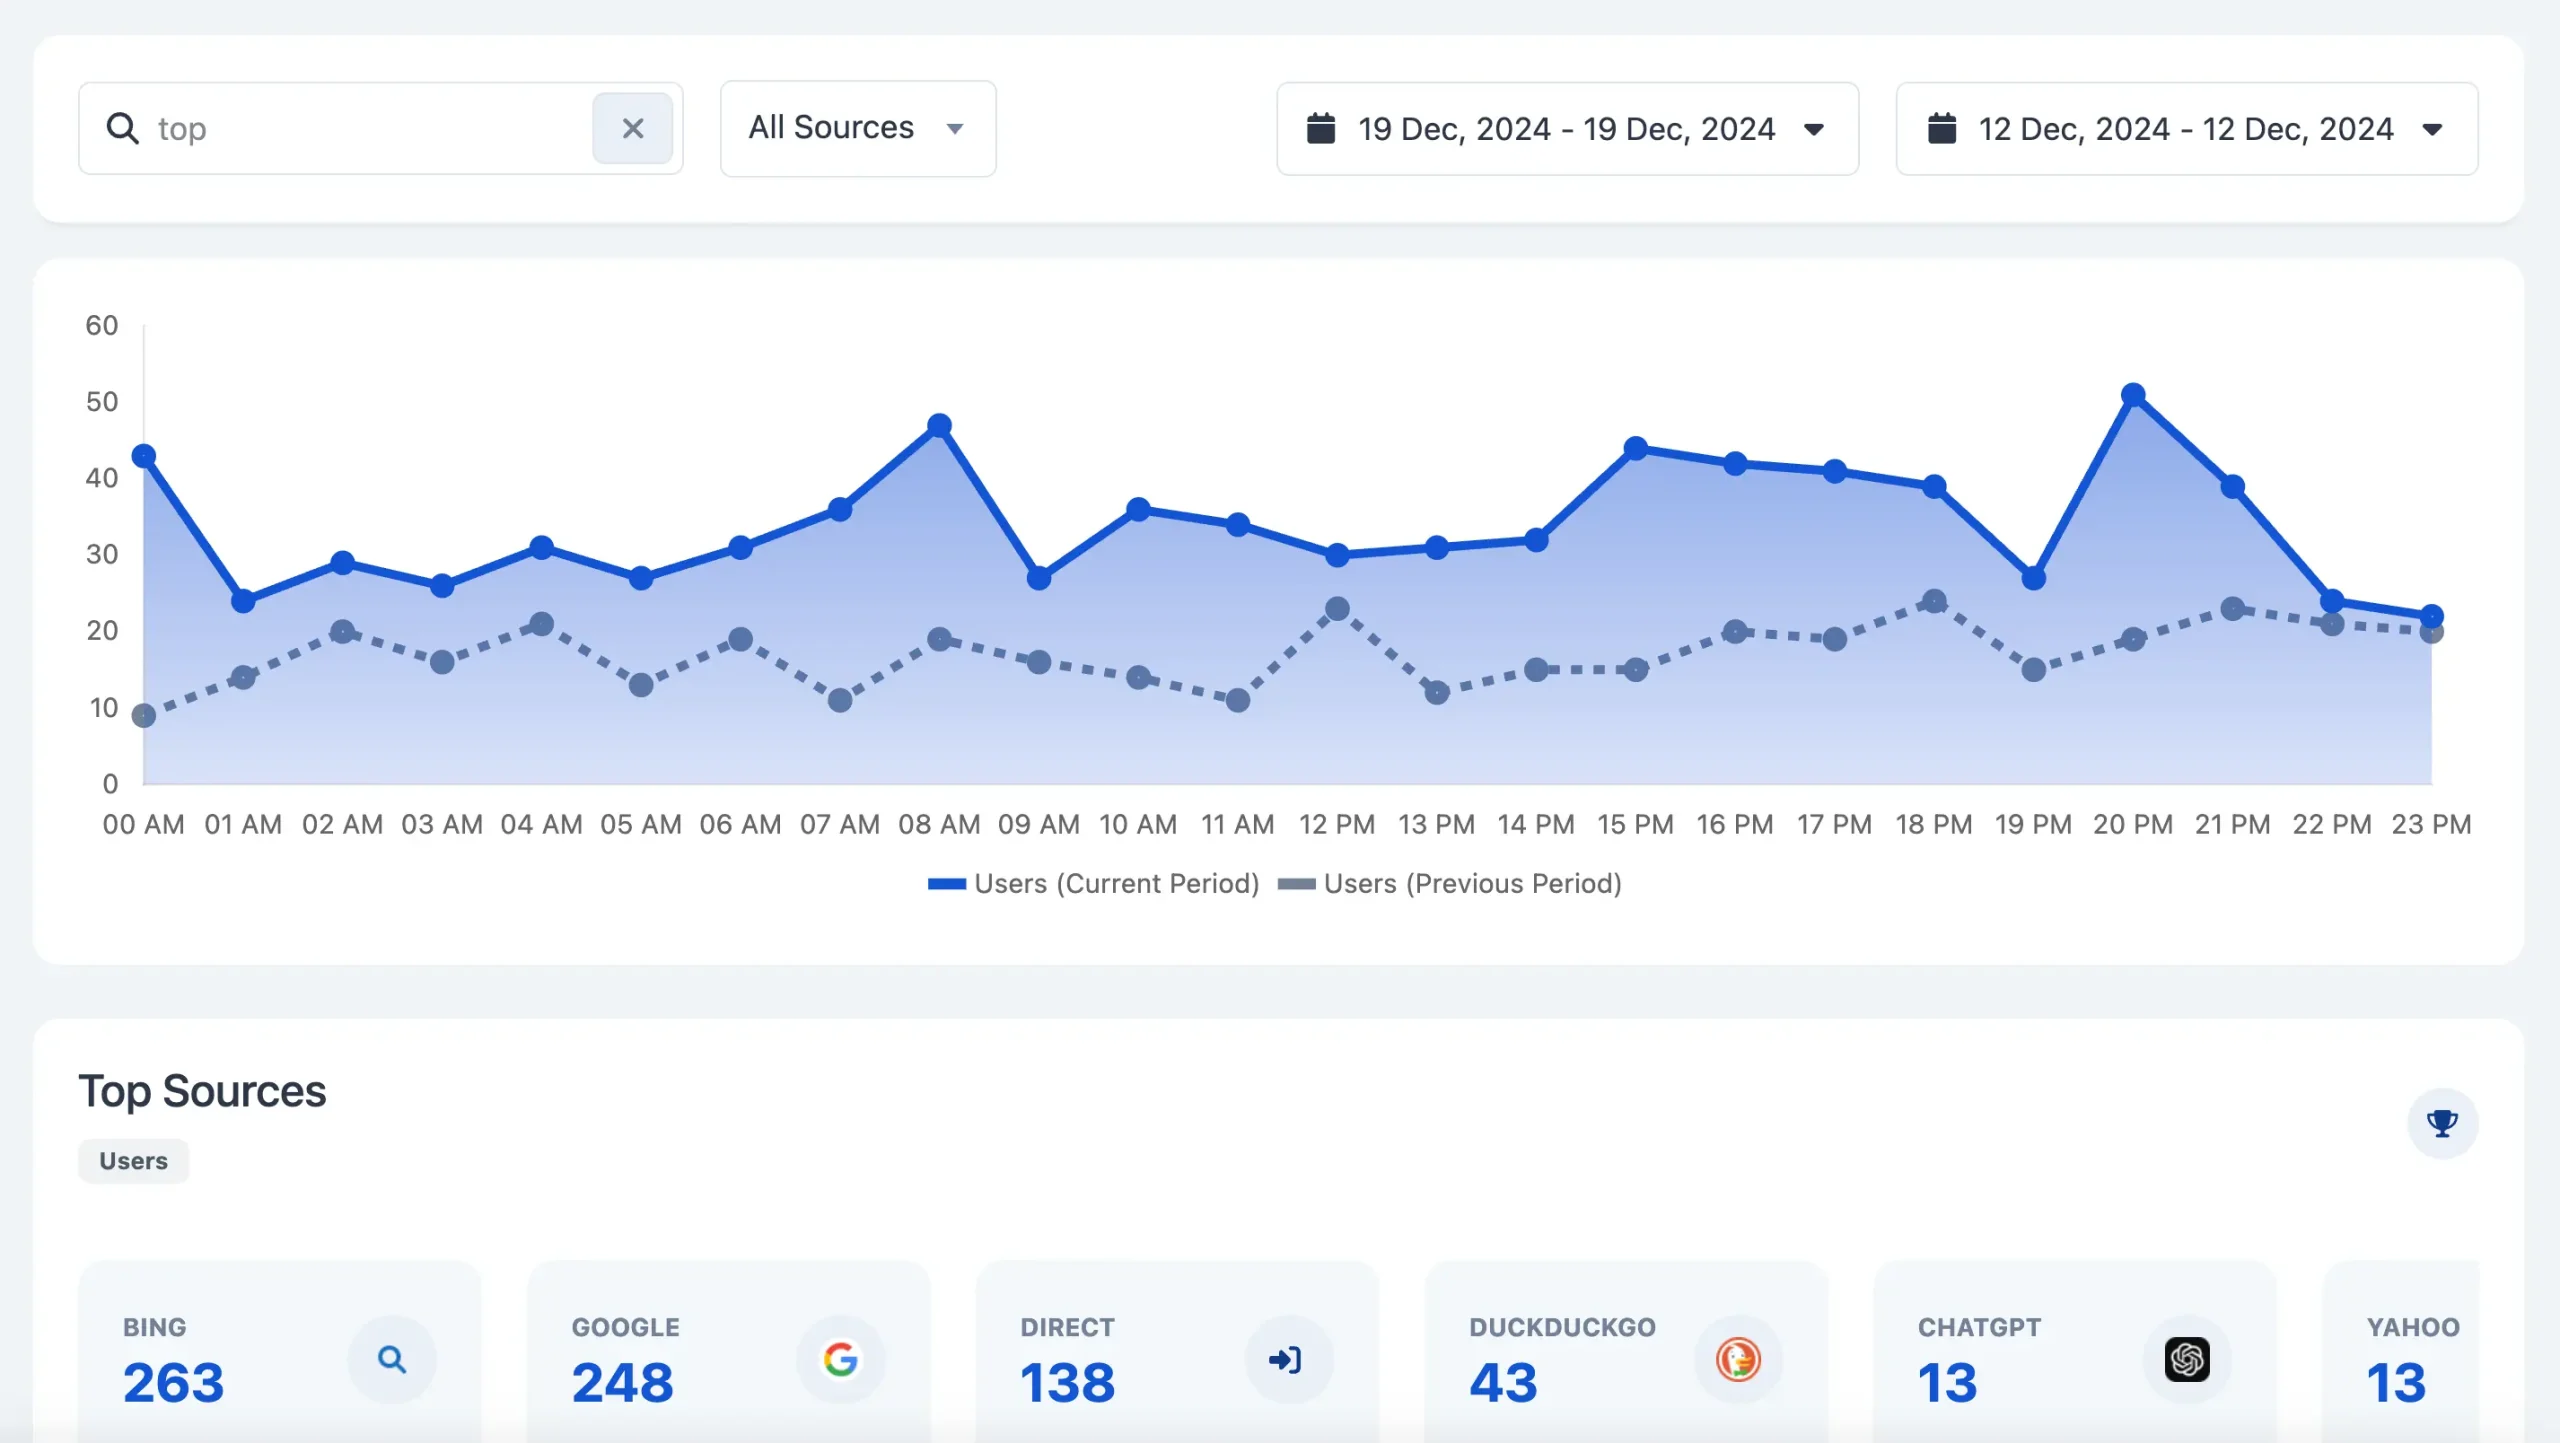
You can then drill down by ‘Source’ or use the date pickers to view and compare your traffic.
4. Understand the Impact of Google Changes On Your Traffic
Another useful feature that can save you a lot of time and help you make informed decisions about your SEO is our built-in support for Google algorithmic changes.
Whenever there is a formal Google update, it is recorded in the system, allowing you to see the impact on your traffic easily.
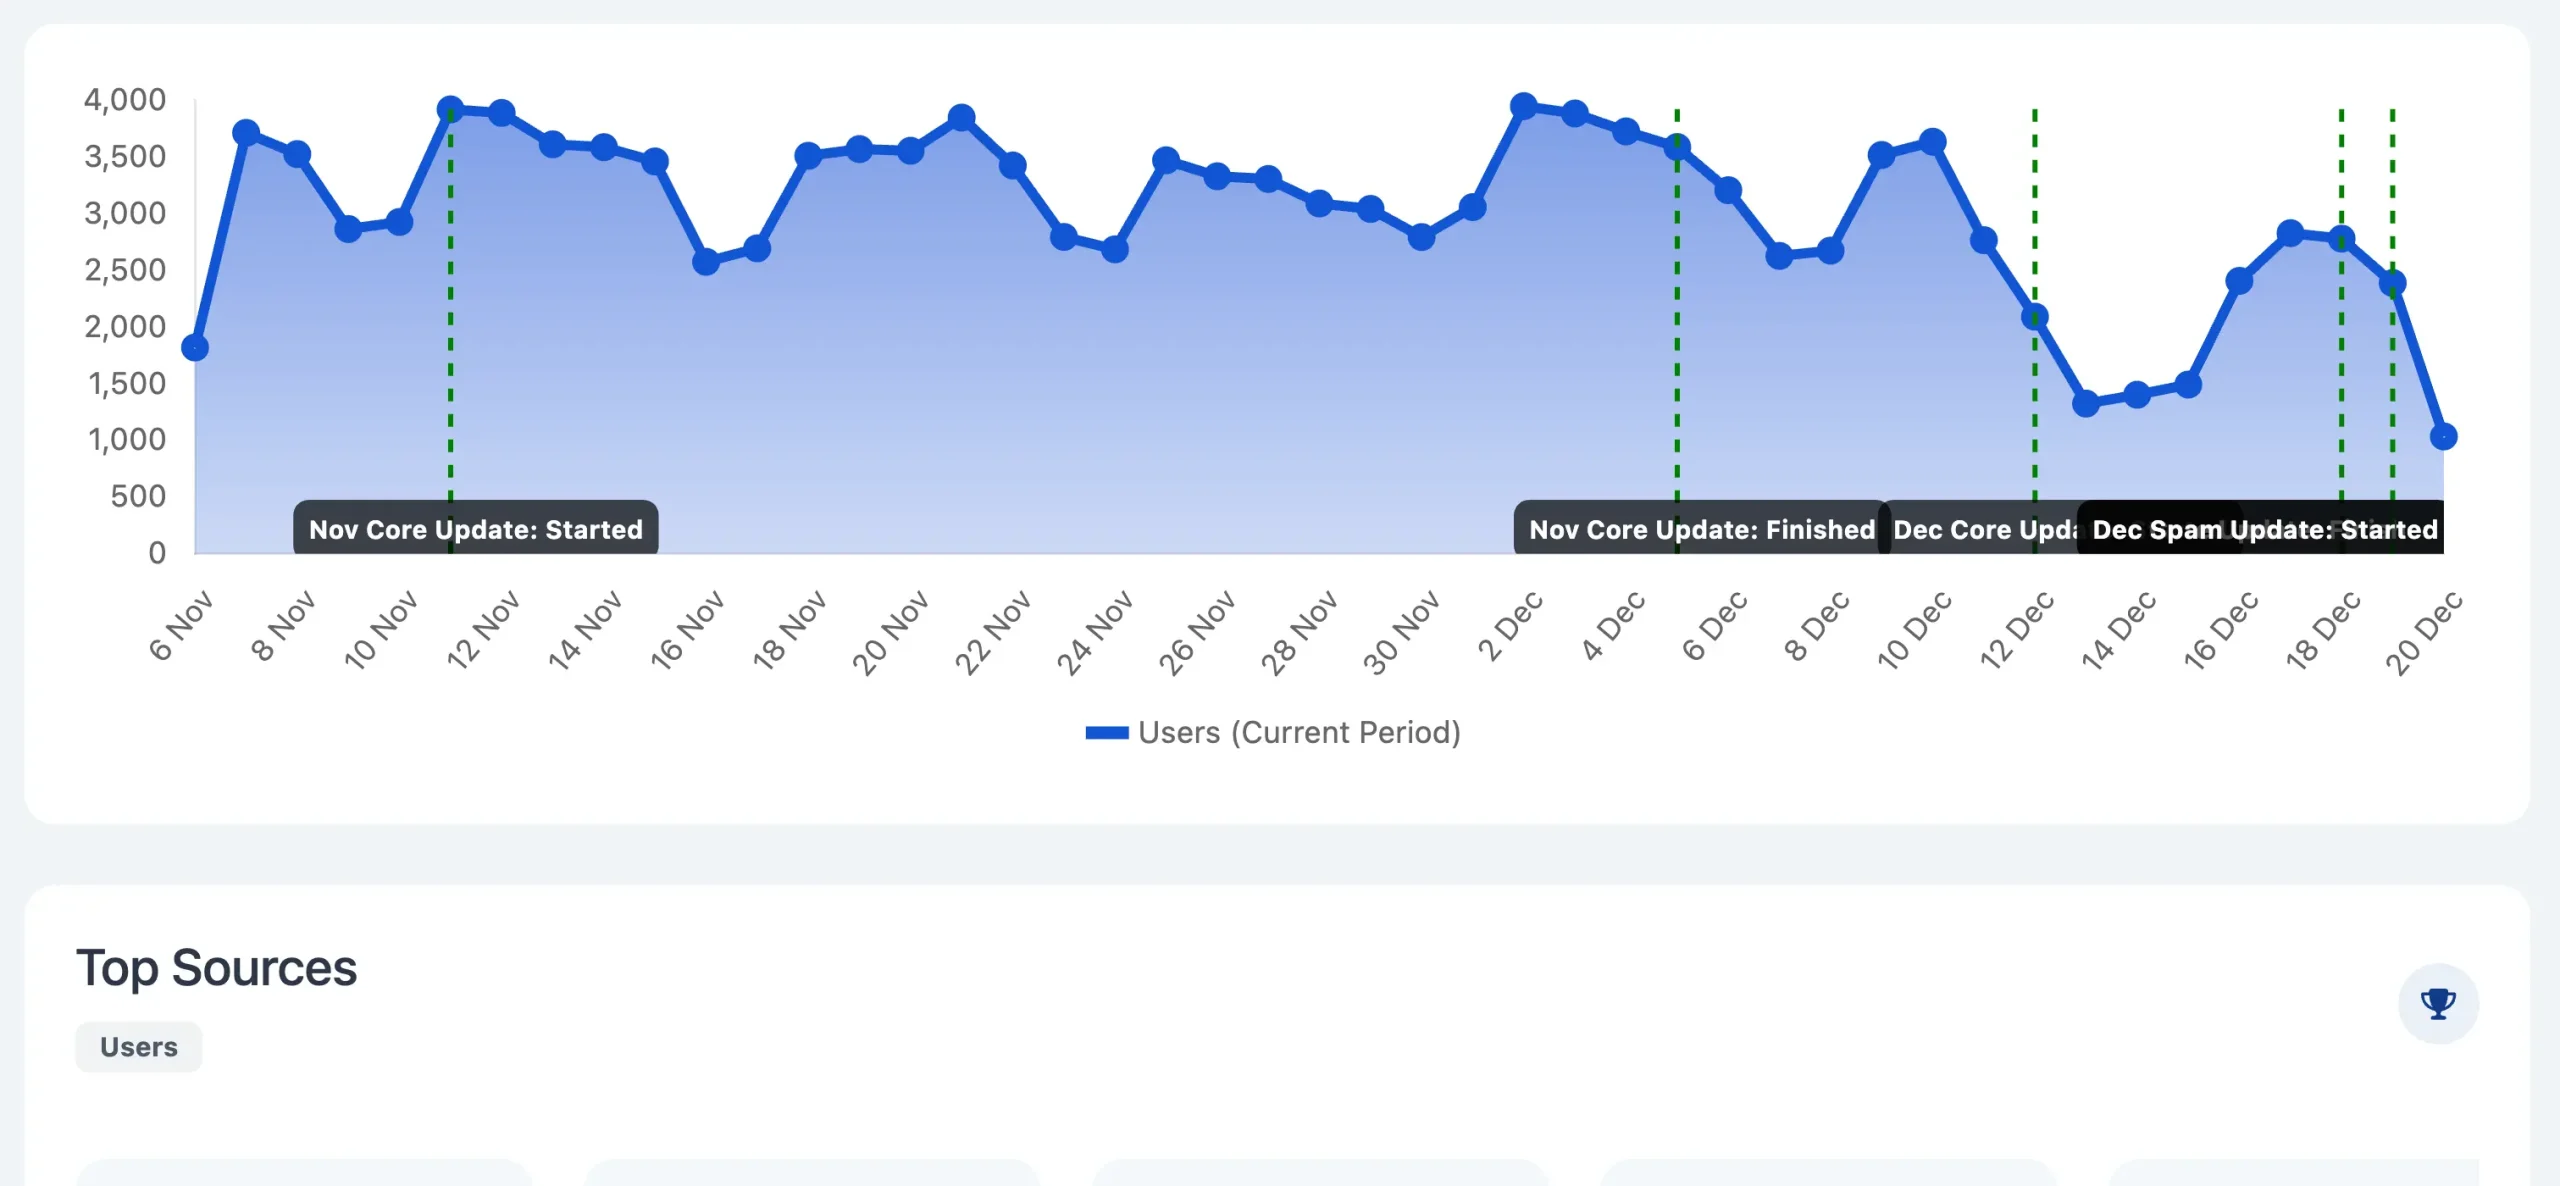
For example, Google made several updates to its ranking system in November and December.
By selecting the relevant traffic period and ‘Google’ as the source, you can see the dates the updates started and finished and the effect on your traffic.
You can then use the ‘Sorting’ capabilities of the table to find which pages gained and lost traffic between updates.
To get a more accurate picture, compare a week before an update has started to a week after an update has finished.
5. View Content Performance By Day
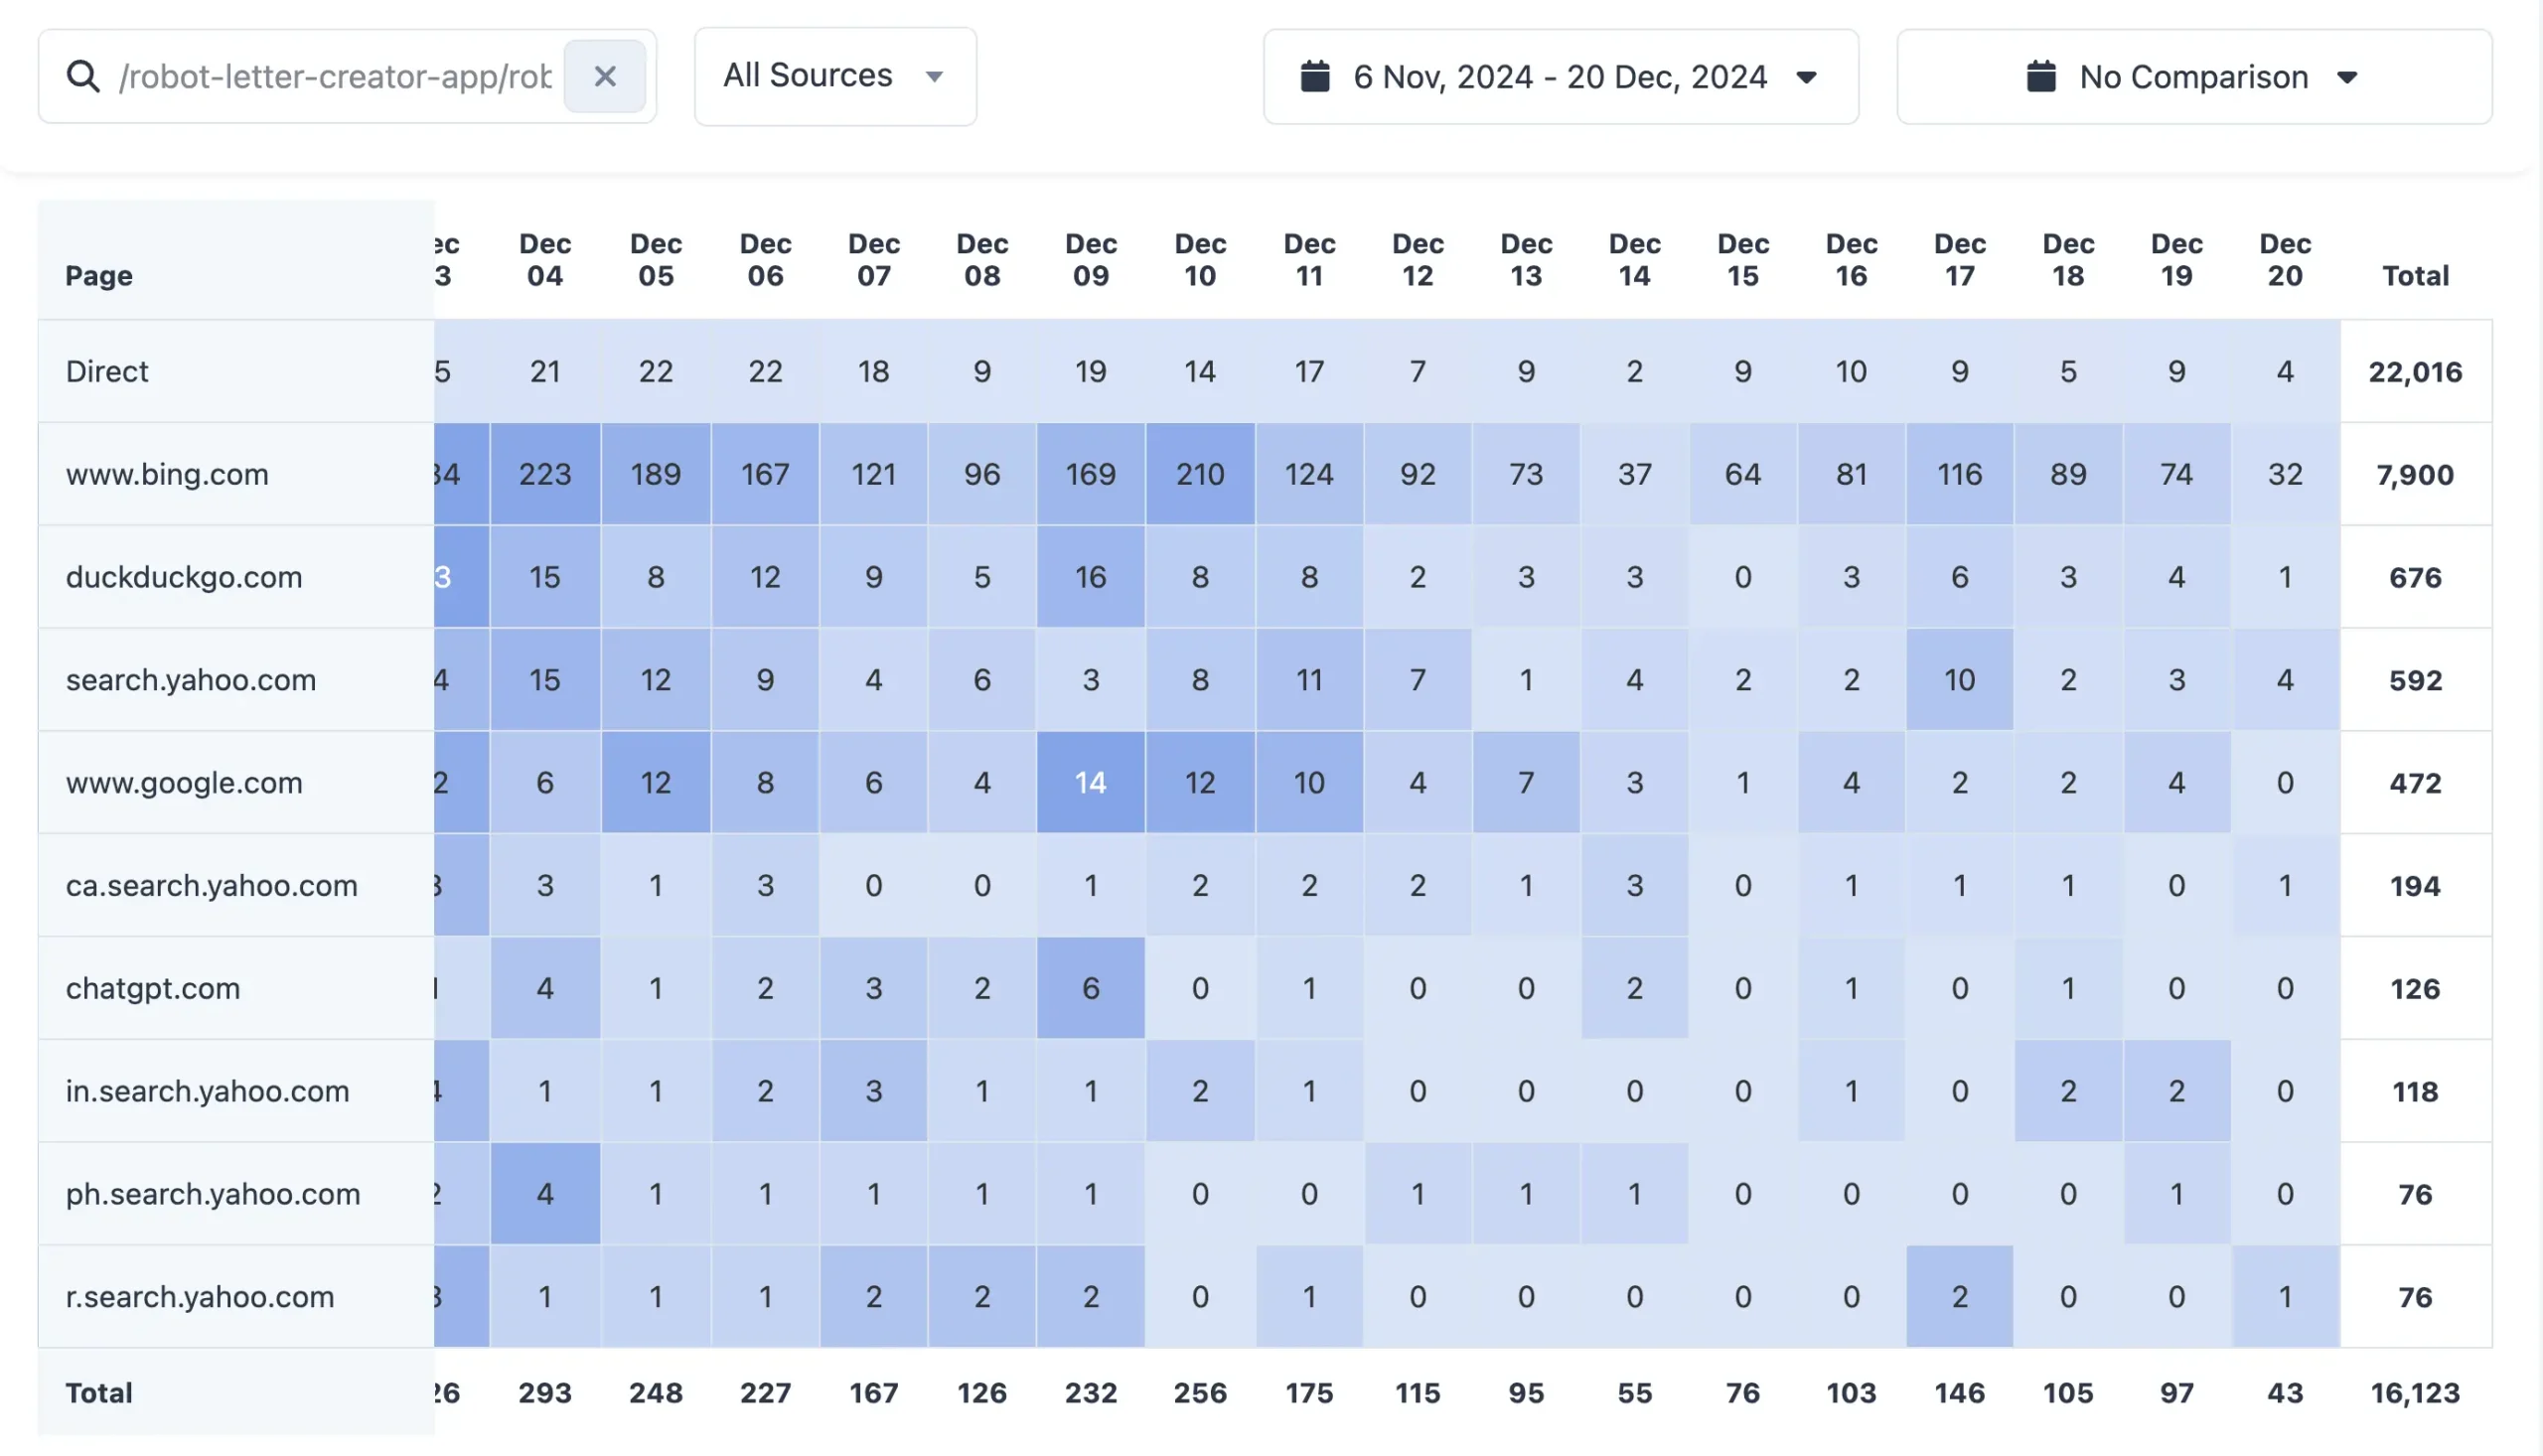
When working on your content marketing, it’s crucial to see daily statistics of how your content is performing. This feature is missing from other platforms, but with LookAnalyze you can see your daily performance by page or traffic source.
When you scroll down to the daily view, you can easily spot when the traffic for a particular page changes.
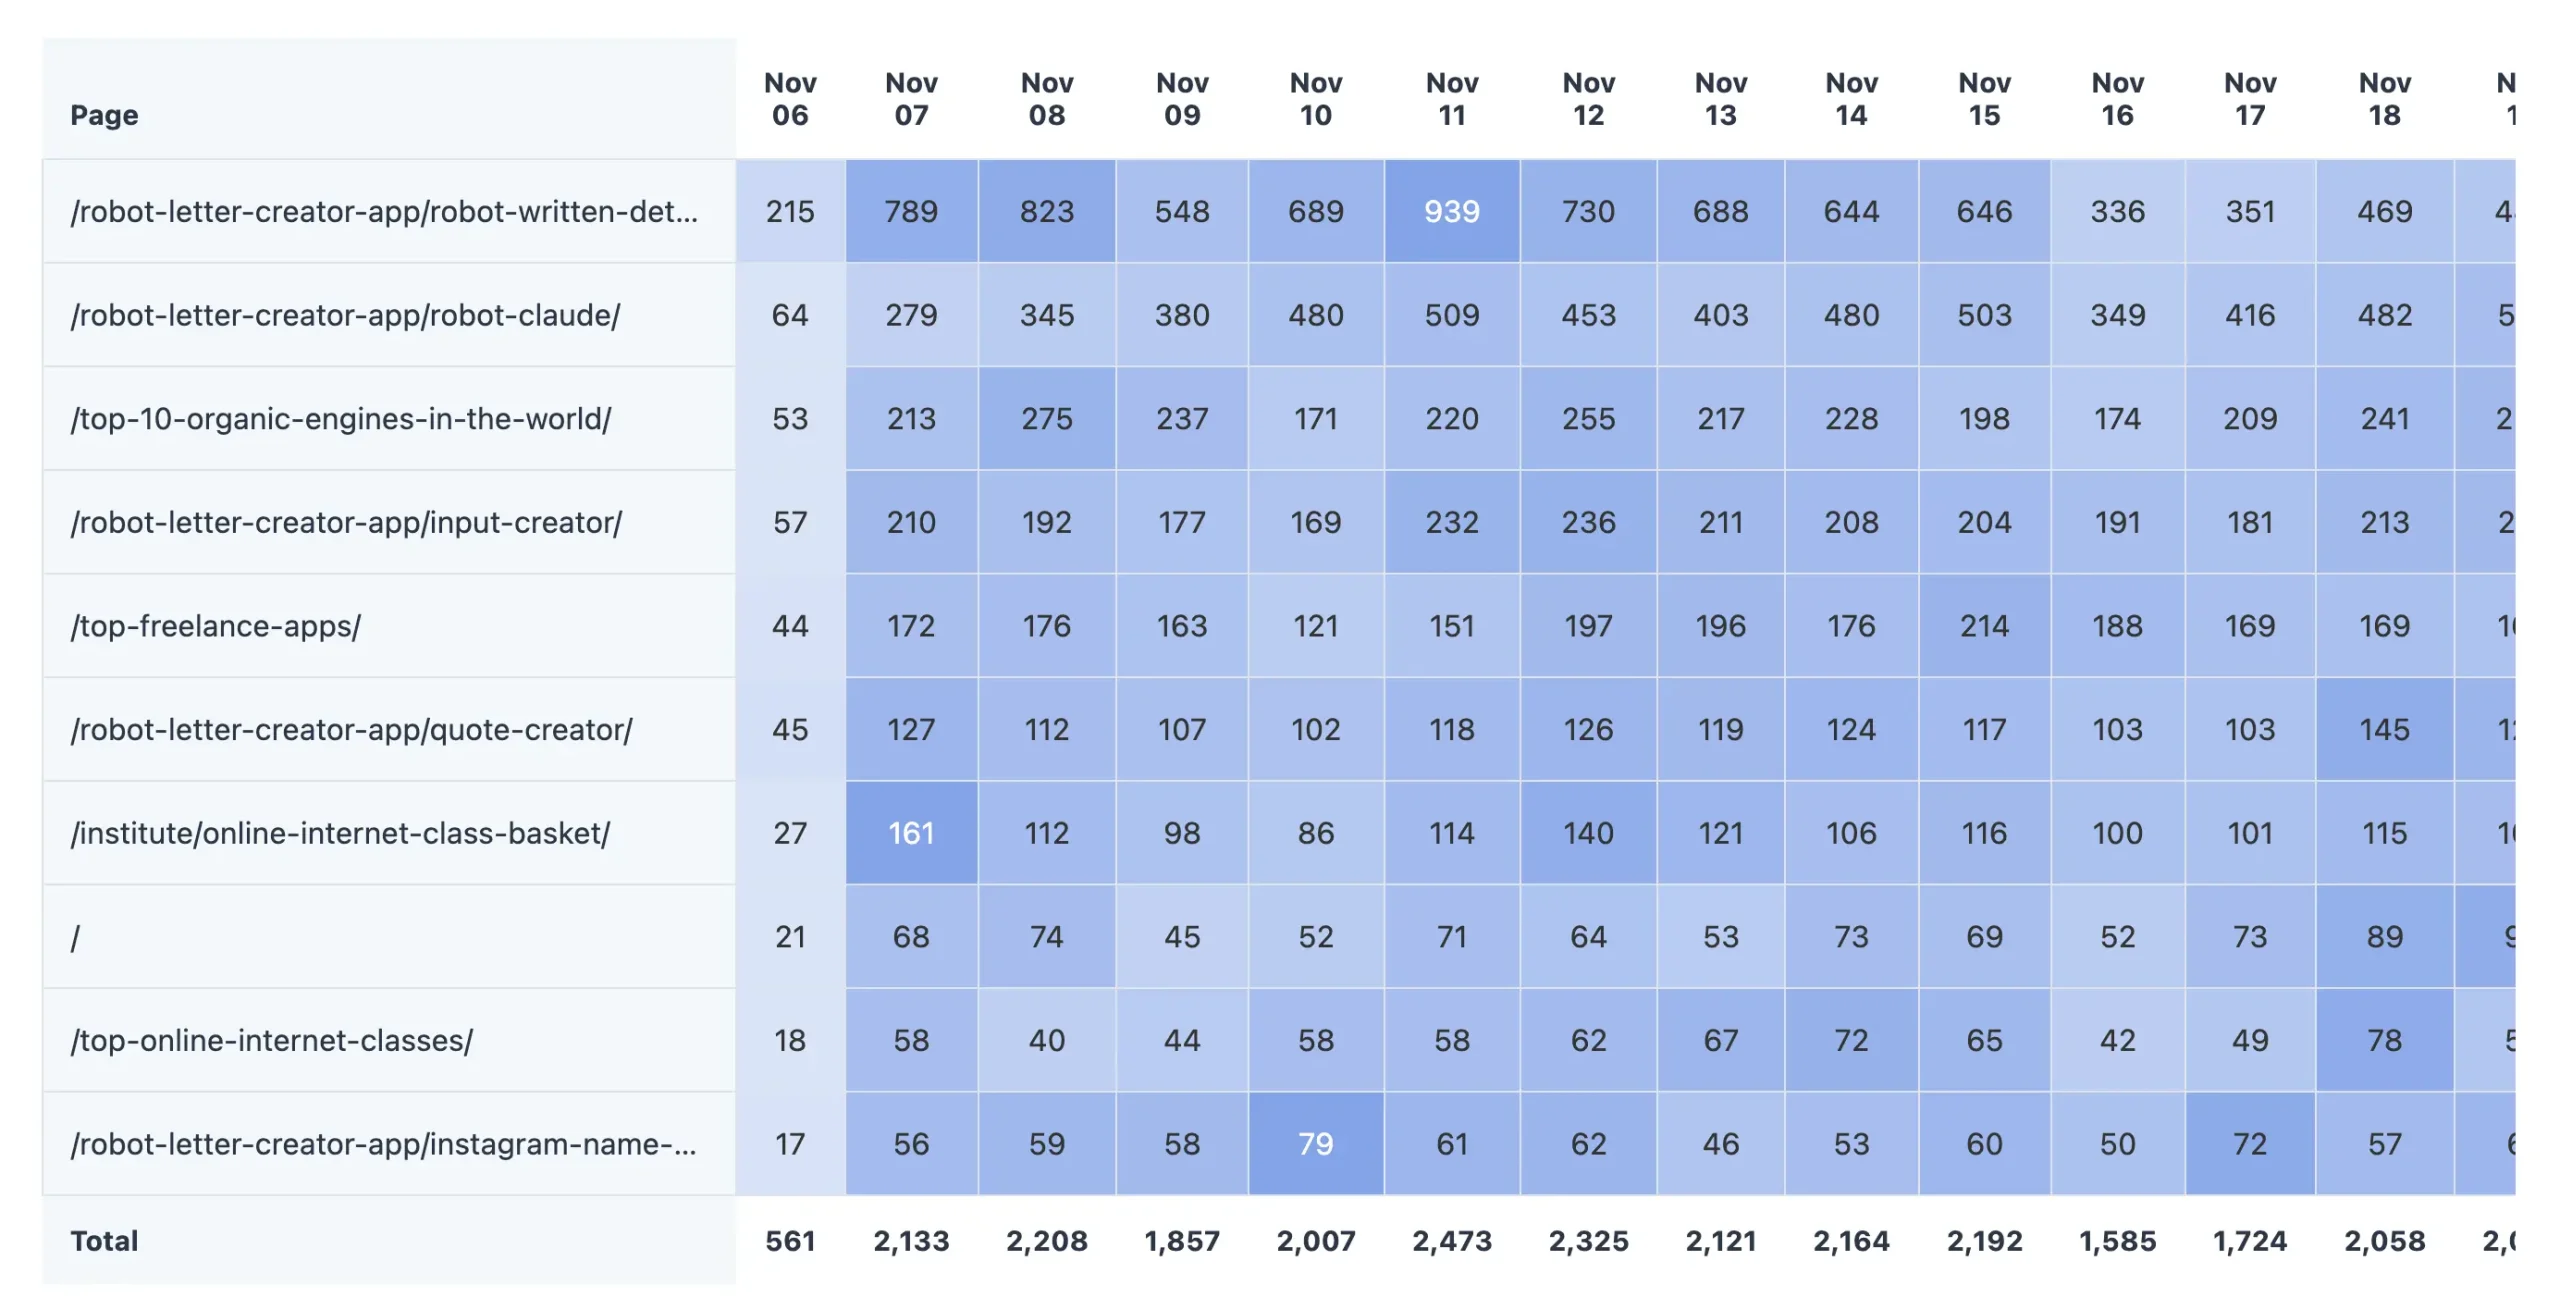
When you click or filter by page, you can see daily traffic by source and identify changes for the particular page (or group of pages).
For example, if you look closely at the screenshot below, you will notice that Bing traffic for the particular page has been dropping constantly over the last couple of weeks.
Without LookAnalyze, you must export your data from GA and use spreadsheets or other reporting tools to get this info.
6. Find Your Most Valuable Pages To Grow Your Business
A website’s primary purpose is to encourage users to perform critical actions, such as purchasing or submitting a contact form, eventually generating more business.
To do this successfully, you need to know which landing pages and traffic sources generate conversions, and you can do this in LookAnalyze with a few simple clicks.
- The first step is to set up your Goals.
- Click Goals from the left menu and then “Create”.
- Enter a name for your Goal and specify the page users visit after converting.
Here are some examples:
- A user submits a contact form and sees a “Thank You” page.
- A user completes a purchase and lands on an “Order Confirmation” page.
- A user signs up for your newsletter and is redirected to a “Subscription Success” page.
- A user downloads a free guide or eBook and reaches a “Download Complete” page.
- A user creates an account and is taken to a “Welcome” or “Account Setup” page.
When setting up your Goals, you don’t need to enter the full URL of the page. Instead, you can use a partial path to make tracking easier and more flexible.
For example, if the page users visit after converting is:
/checkout/order-received/1050/
You only need to enter:
/checkout/order-received/
This ensures that LookAnalyze tracks all variations of this page, regardless of specific identifiers like order numbers or session IDs.
Once your website generates conversions, you can view the Landing Pages and Traffic Sources reports.
Landing Pages Report
The Landing Pages report shows the first pages users visited before converting. These are the most valuable pages of your website.
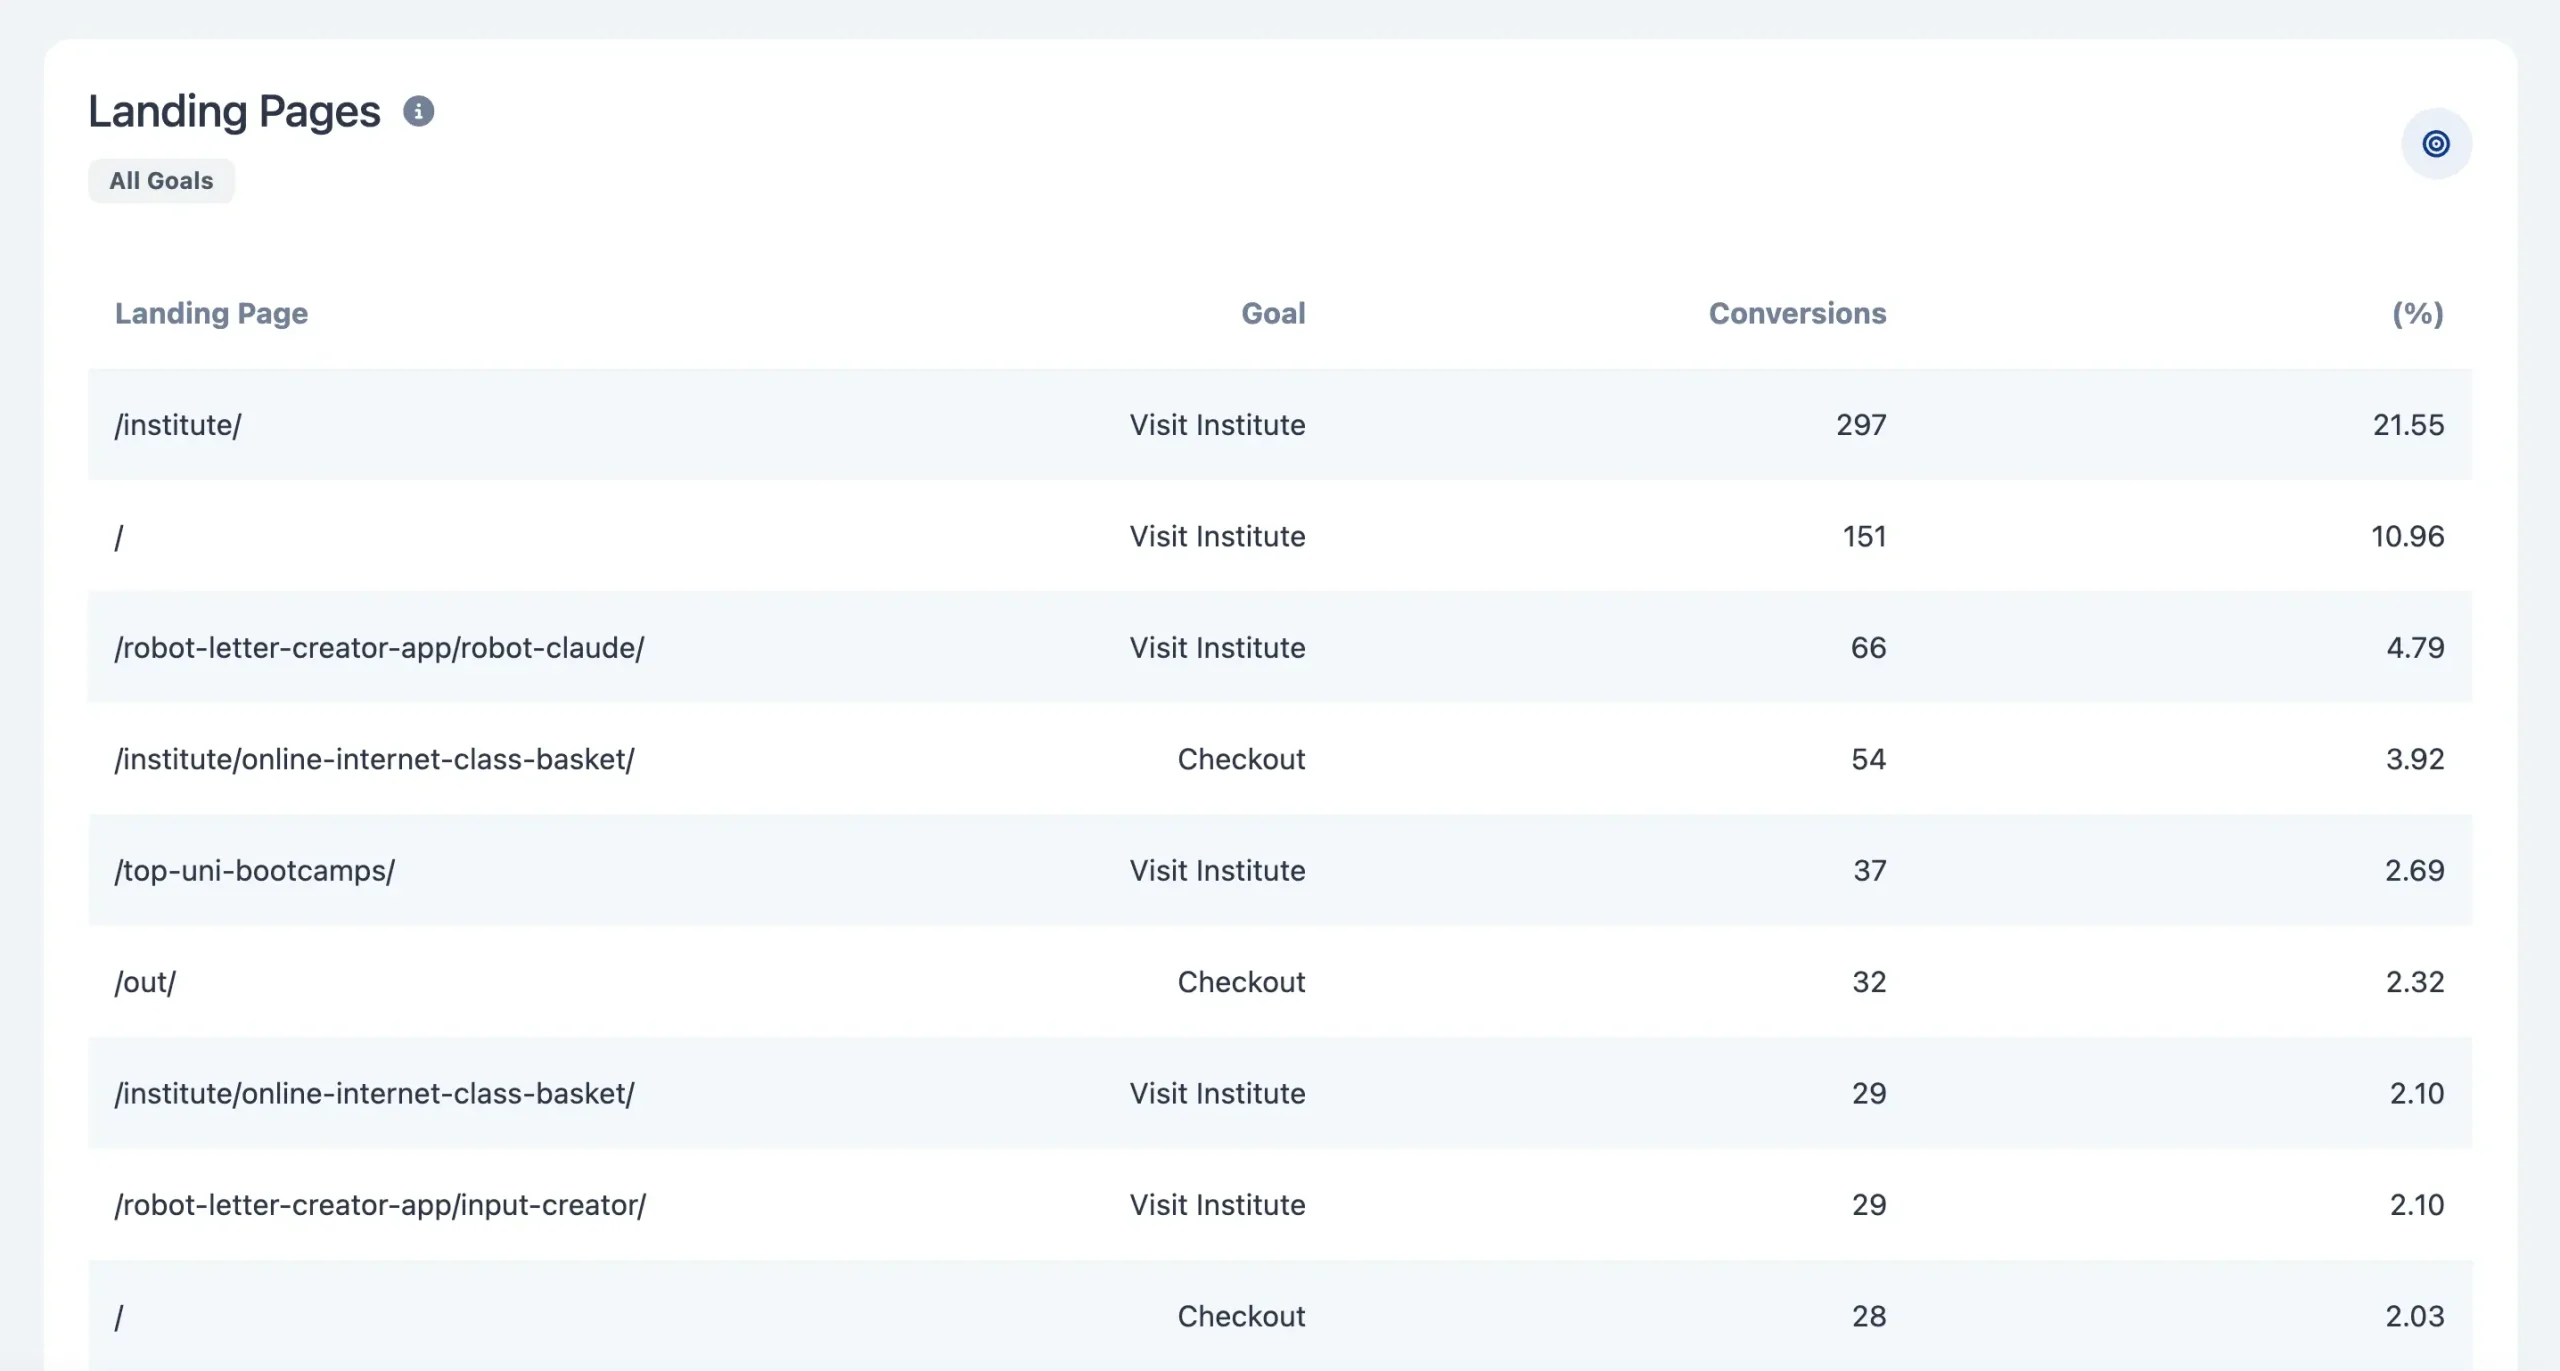
By identifying these key pages, you can focus on optimizing their content, improving the user experience, or driving more traffic to them to maximize conversions.
Use the Goals dropdown to see data for a specific goal.
Traffic Sources Report
The Traffic Sources report helps you understand where your converting visitors are coming from. It breaks down the performance of traffic sources.
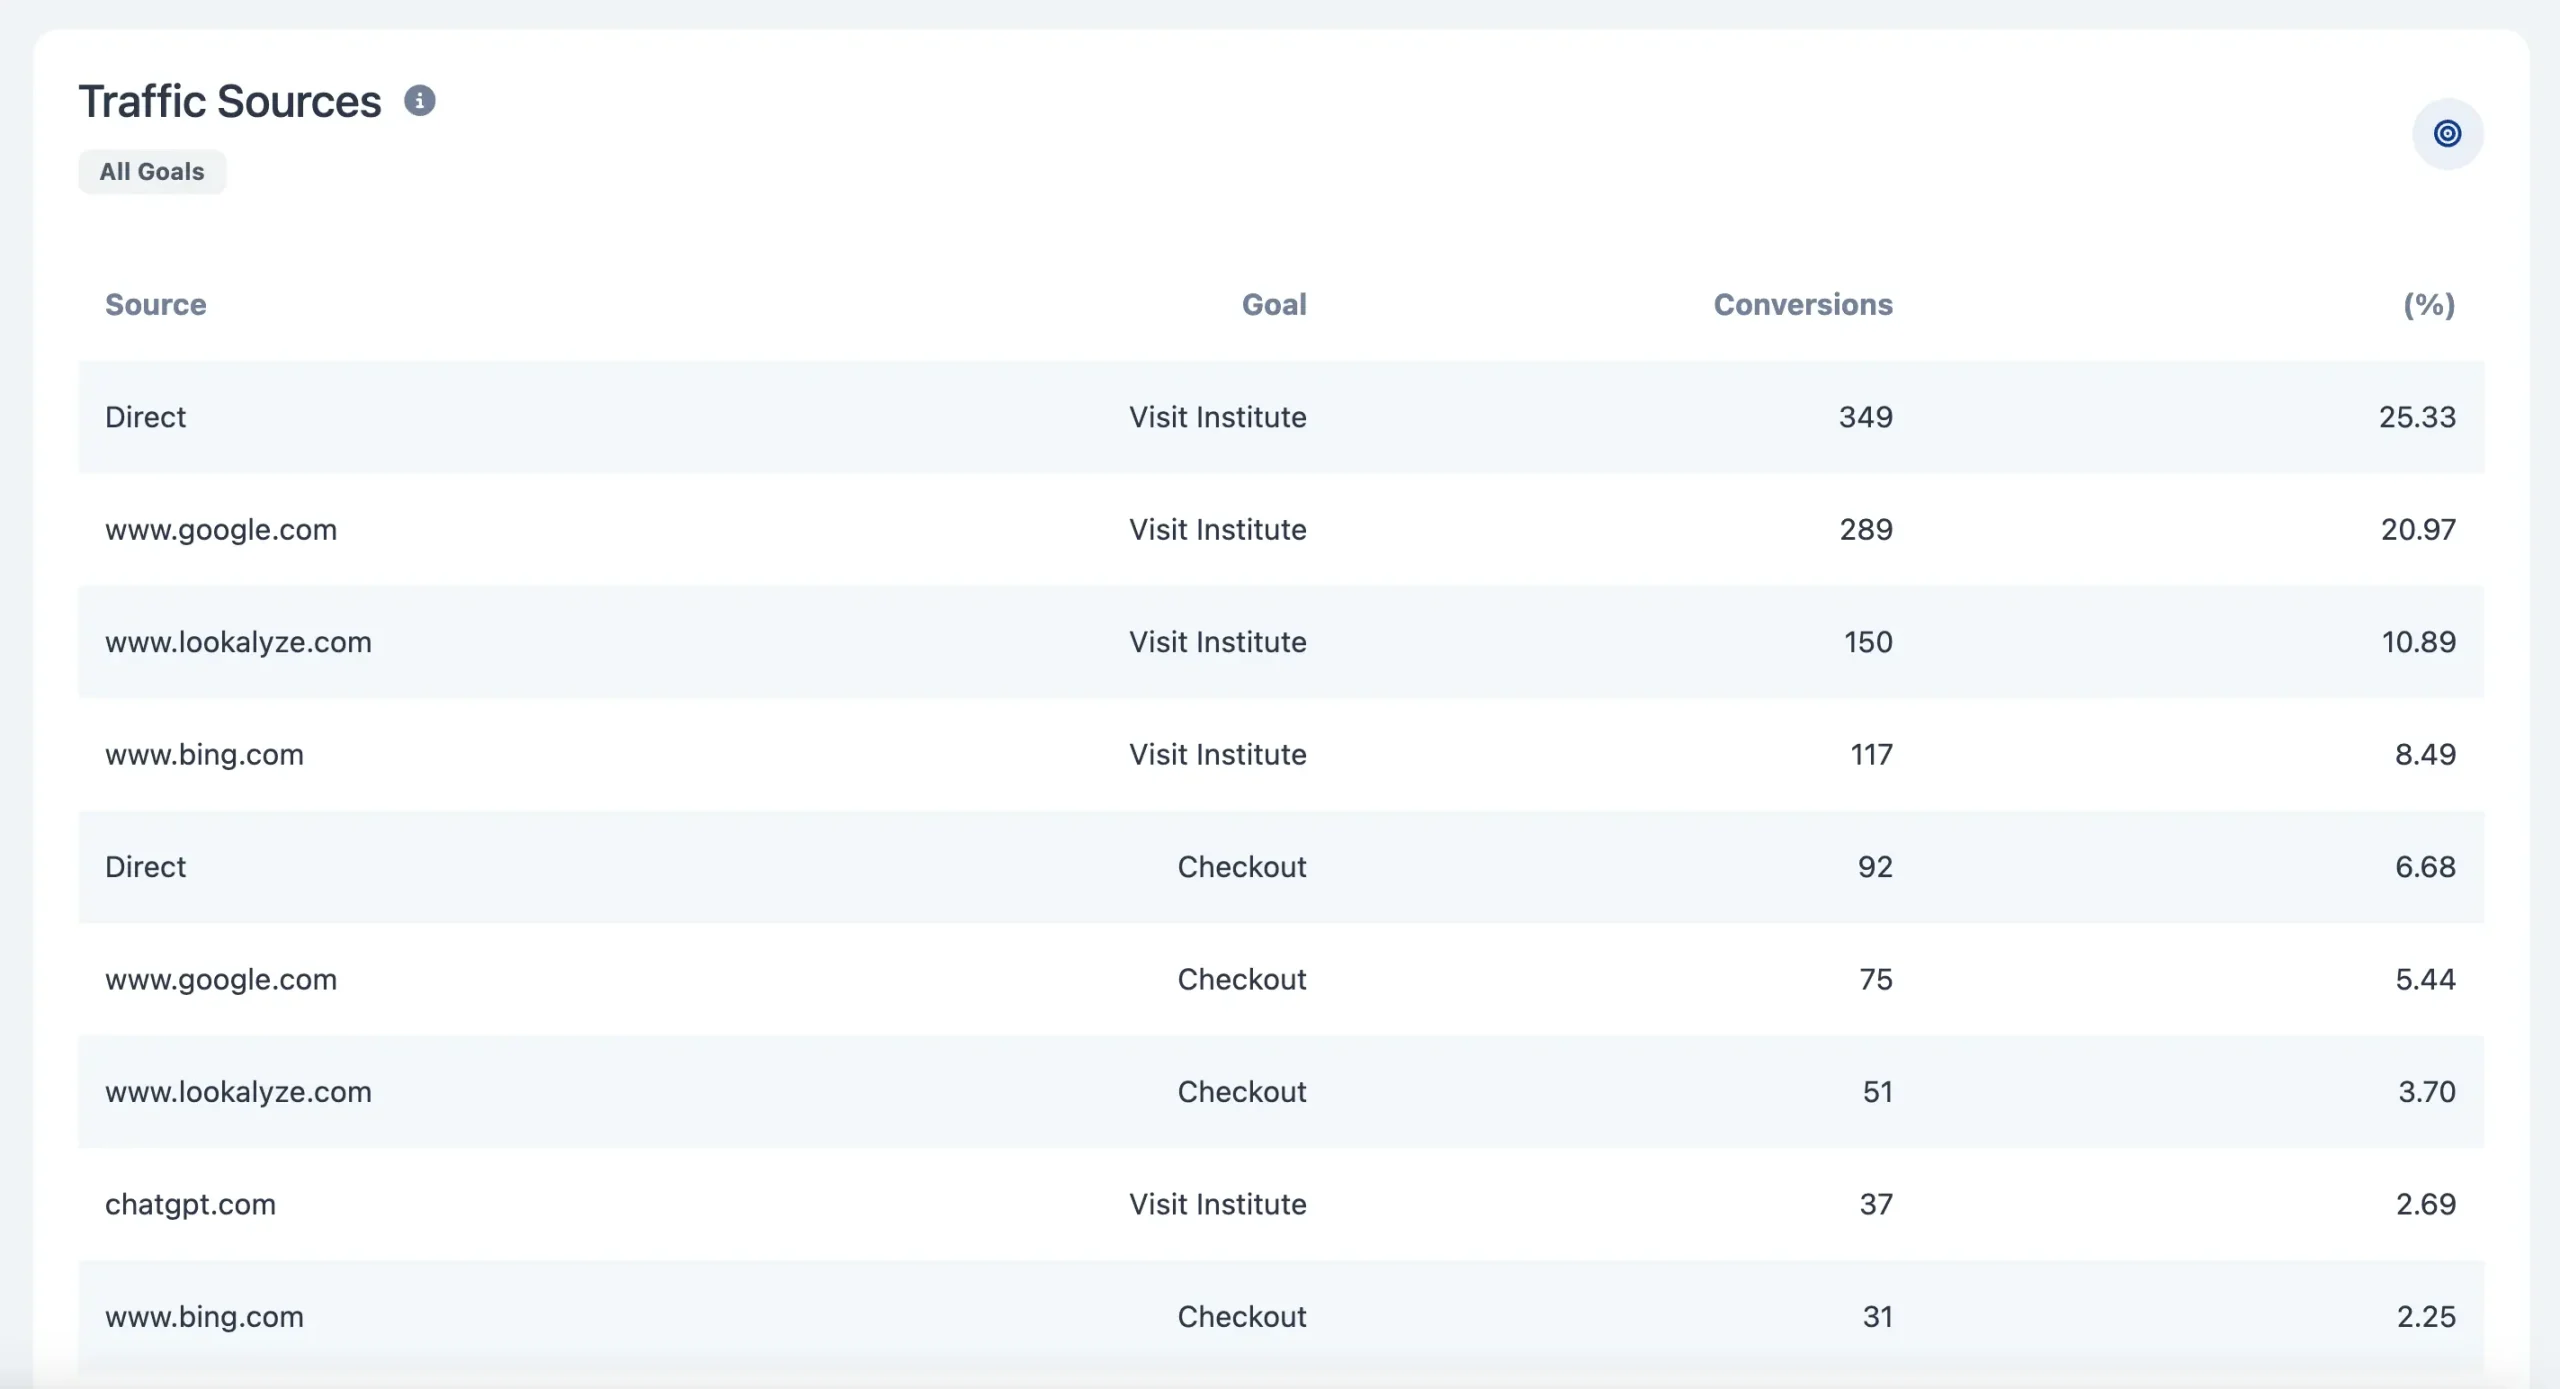
This report shows which marketing efforts and channels are driving the most conversions, allowing you to allocate resources to the ones with the highest ROI.
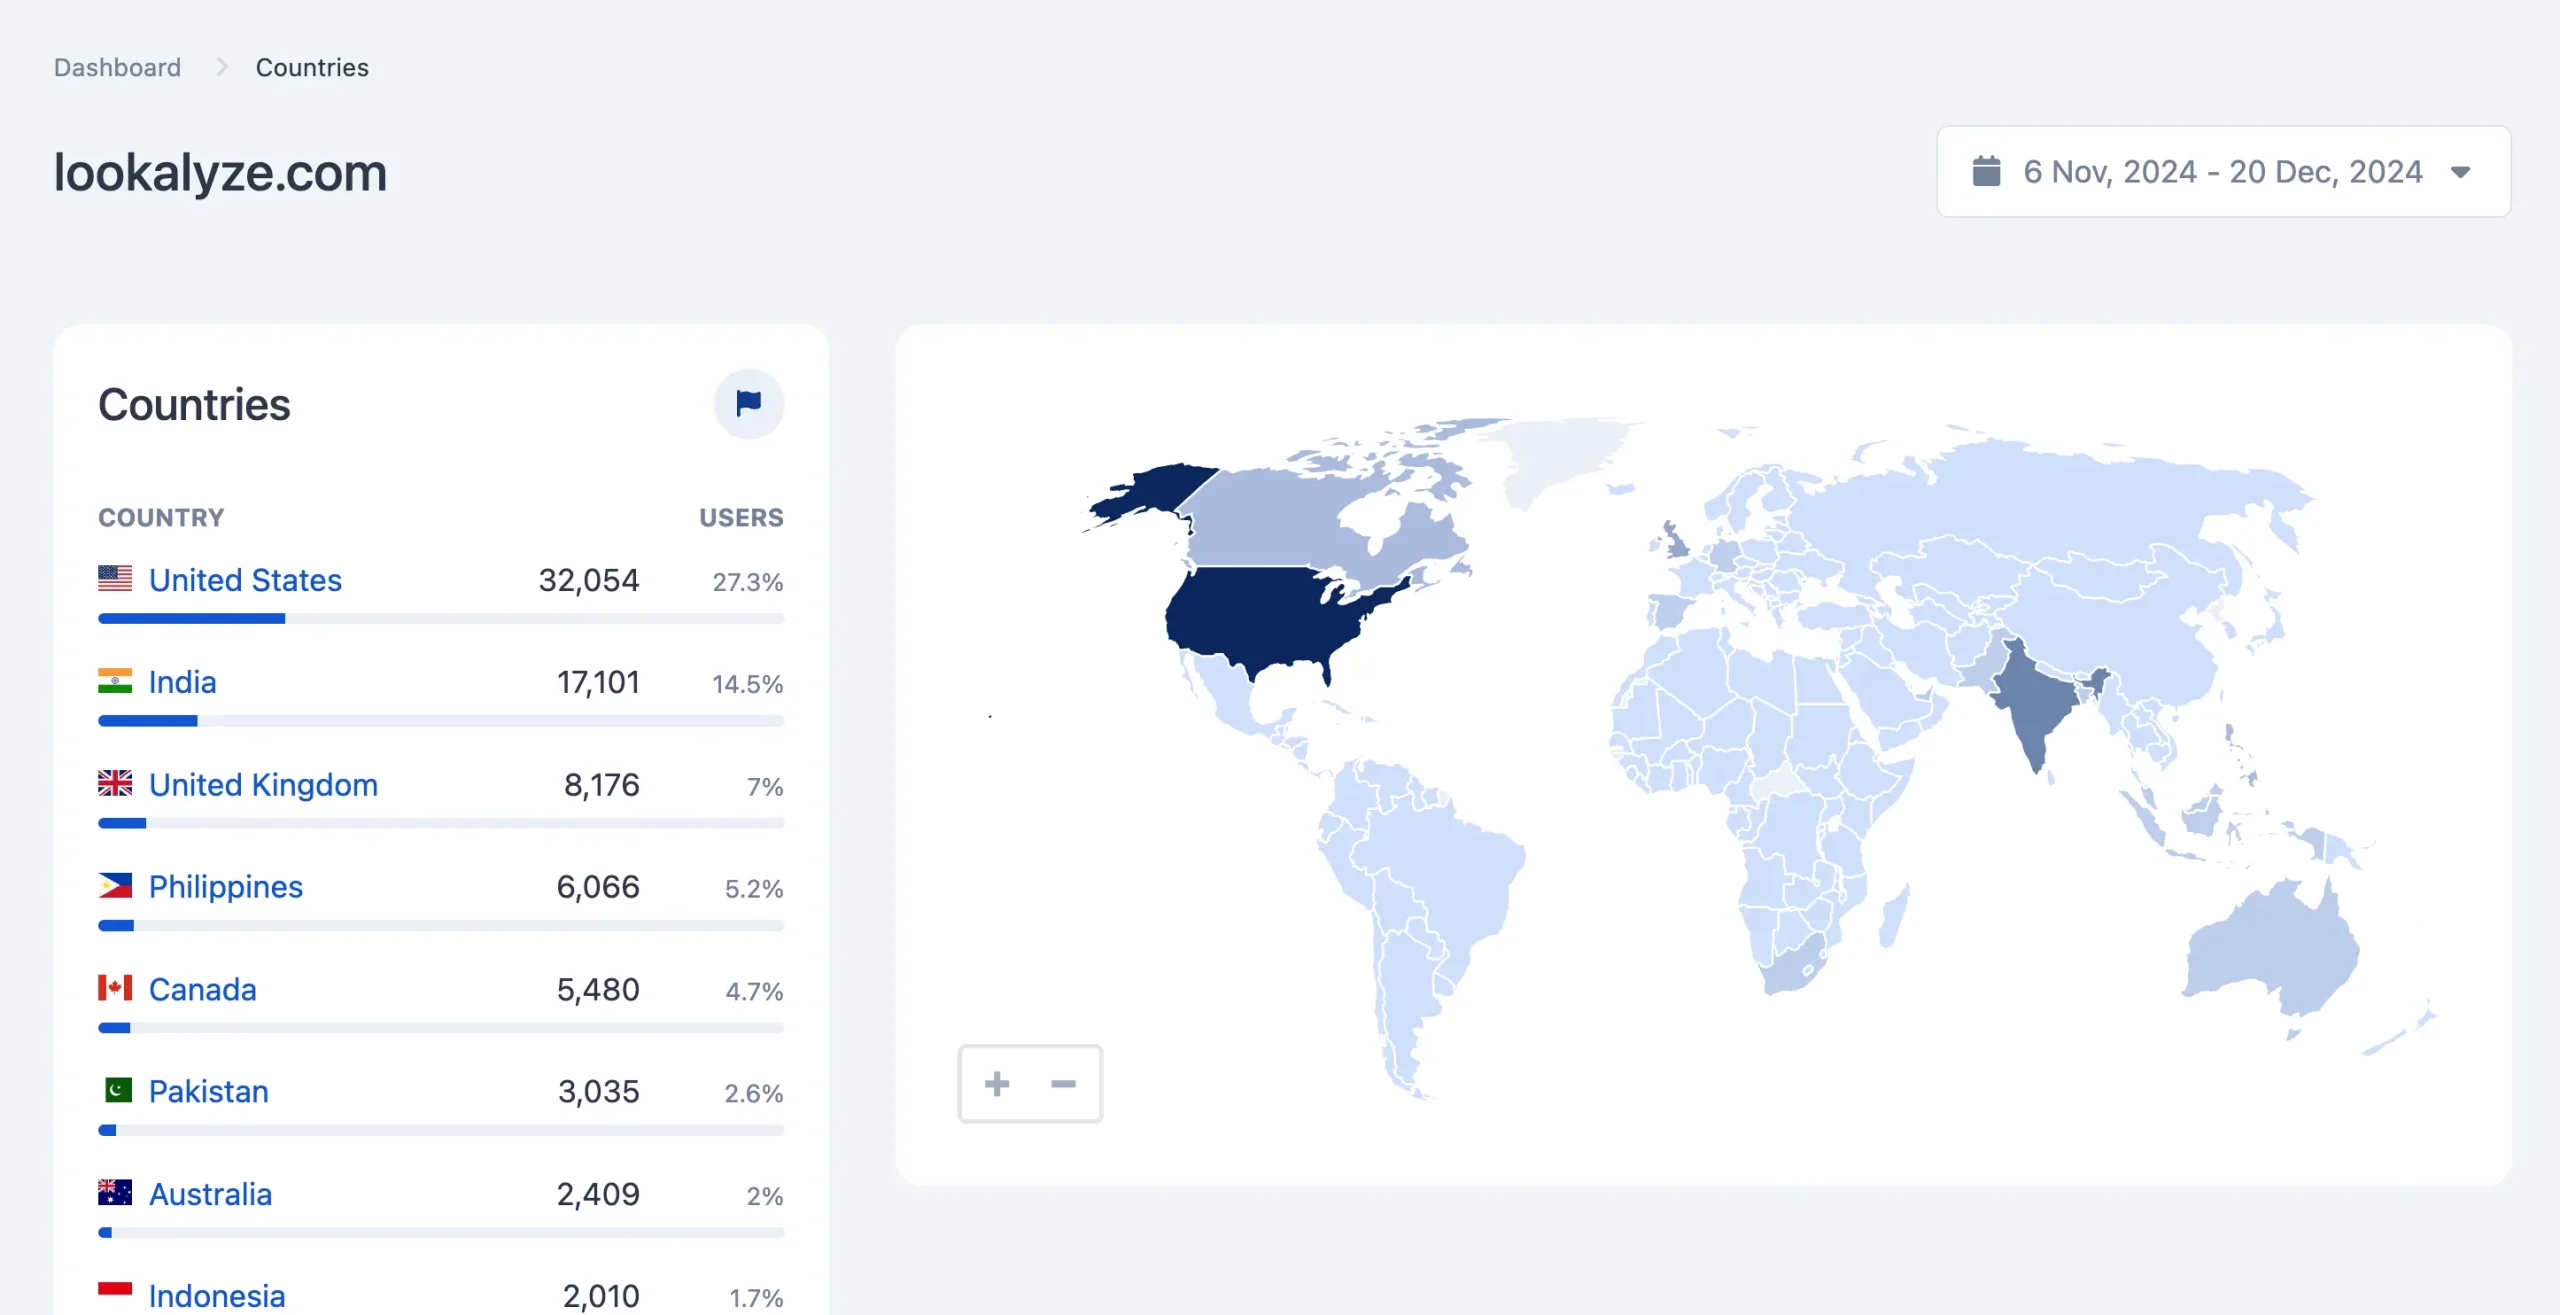
7. Use The Countries Report To See Where Your Visitors Are Located
Besides the ‘Analyze’ feature, LookAnalyze gives you multiple ways to ‘Look’ at your data. One way is to visit the Dashboard, which provides a complete picture of your traffic.
A report that is helpful for marketing purposes is the countries report.
You can use the date picker to see which Countries you get traffic from. Click on a country to get details of the cities.
8. Get Accurate and Timely Data
LookAnalyze solves two more problems for marketers:
First, Google Analytics does not provide real-time data. This is a big issue if you want to see what’s happening on your website right now.
Second, popular marketing tools provide an estimate of traffic and do not provide an accurate picture, plus they give you info for Google only.
If you’ve been in the marketing game for long, for sure you’re faced with a scenario where you log in to a marketing tool and see that your traffic is increasing, while in reality, it’s going the opposite way.
With LookAnalyze, you don’t have to worry about these issues. You get accurate data you can rely on for all your traffic sources and not rough estimates.
You can try LookAnalyze for free on your website (no credit card required) and see for yourself.
There is also a fully functional Live Demo (no login required) to play around with the different features.